With the migration to modern dashboards many of us are rolling out thanks to the awesomesauce that is 2020.2 I had hit a snag on the "latency/packet loss" graphic widget in classic. After a few weeks trial and error and a lot of help with swql nesting from @daniel_ on this I'm ready to share.
Our environment has 2 WAN links in an active state at all times so it was important to have the new KPI widget show results of both links in a single widget to make room for other data on the dash.
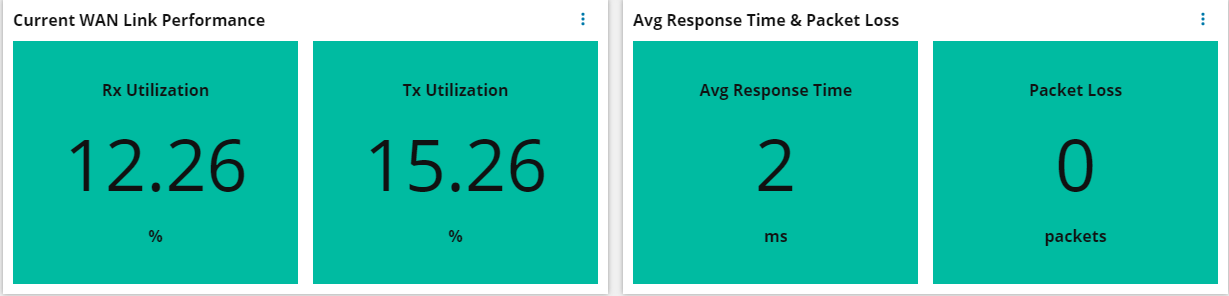
Percent Utilization:
Step 1: Get the nodeIDs of your WAN links.
Step 2: Receive(Rx) Put them into this swql snippet where it says 'yournodeID1' and 'yournodeID2' e.g. (1234,1235)
select round((avg(nit.InPercentUtil)),2) as averageInPercentUtil
  from Orion.NPM.InterfaceTraffic as nit
    where nit.InterfaceID in (yournodeID1,yournodeID2)
      and tolocal(nit.DateTime)>=addminute(-5,getdate())
Step 3:Set thresholds as appropriate: Good starting point is warn at 75%, crit at 85%.
Step 4: Transmit(Tx) Put them into this swql snippet where it says 'yournodeID1' and 'yournodeID2' e.g. (1234,1235)
select round((avg(nit.OutPercentUtil)),2) as averageOutPercentUtil
 from Orion.NPM.InterfaceTraffic as nit
   where nit.InterfaceID in (yournodeID1, yournodeID2)
   and tolocal(nit.DateTime)>=addminute(-5,getdate())
Step 5: Set thresholds as appropriate: Good starting point is warn at 75%, crit at 85%.
Avg Response Time:
Step 1: Using same nodeIDs put them into this swql snippet where it says 'yournodeID1' and 'yournodeID2' e.g. (1234,1235)
select (sum(ort.AvgResponseTime)) as AvgResponseTime from Orion.ResponseTime as ort where ort.nodeID in (yournodeID1, yournodeID2) and tolocal(ort.DateTime)>=addminute(-5,getdate())
Step 2: Set thresholds as appropriate: Good starting points are warn at 100ms, crit at 125ms. Set them just under the requirements for most critical application need (VDI, VPN, Replication, etc)
Packet Loss:
Step 1: Repeat Step 1 from above.
select (sum(ort.PercentLoss)) as PercentLoss from Orion.ResponseTime as ort where ort.nodeID in (1371,1378) and tolocal(ort.DateTime)>=addminute(-5,getdate())
Step 2: Set thresholds as appropriate: Good starting points are warn at 20% crit at 40%
Click submit and there you have it aggregated WAN link monitoring in a KPI widget (well 4 of them total but that's better than 8 right?
Caveats: These round to 2 digits after the decimal. If it's below 1% it will report null. These are also averages over 5 minutes so may sometimes be off by a few percentage points from live data on an ASR or whatever your edge routers are.