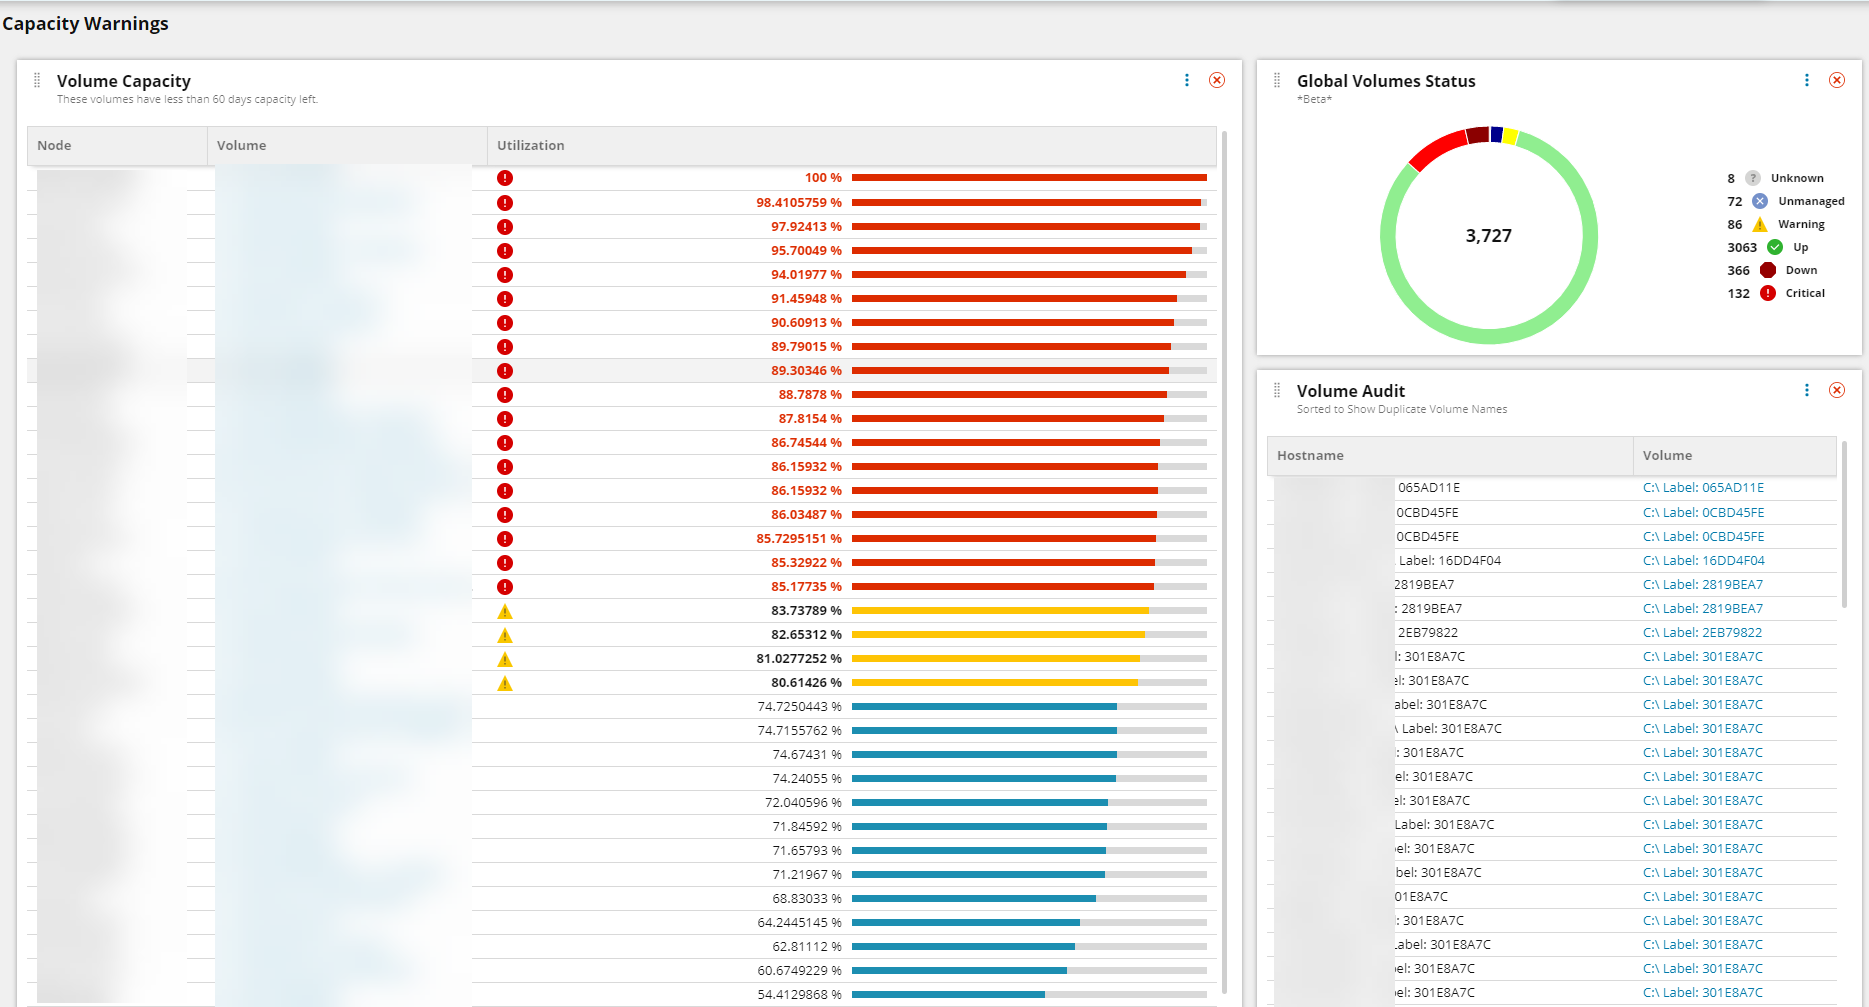
As I continue to explore the possibilities with the new Modern Dashboard in 2020.2 I decided a visual view of Volume Capacity would work better than relying on the "60 days until volume is full" oob alert.
So I built this:
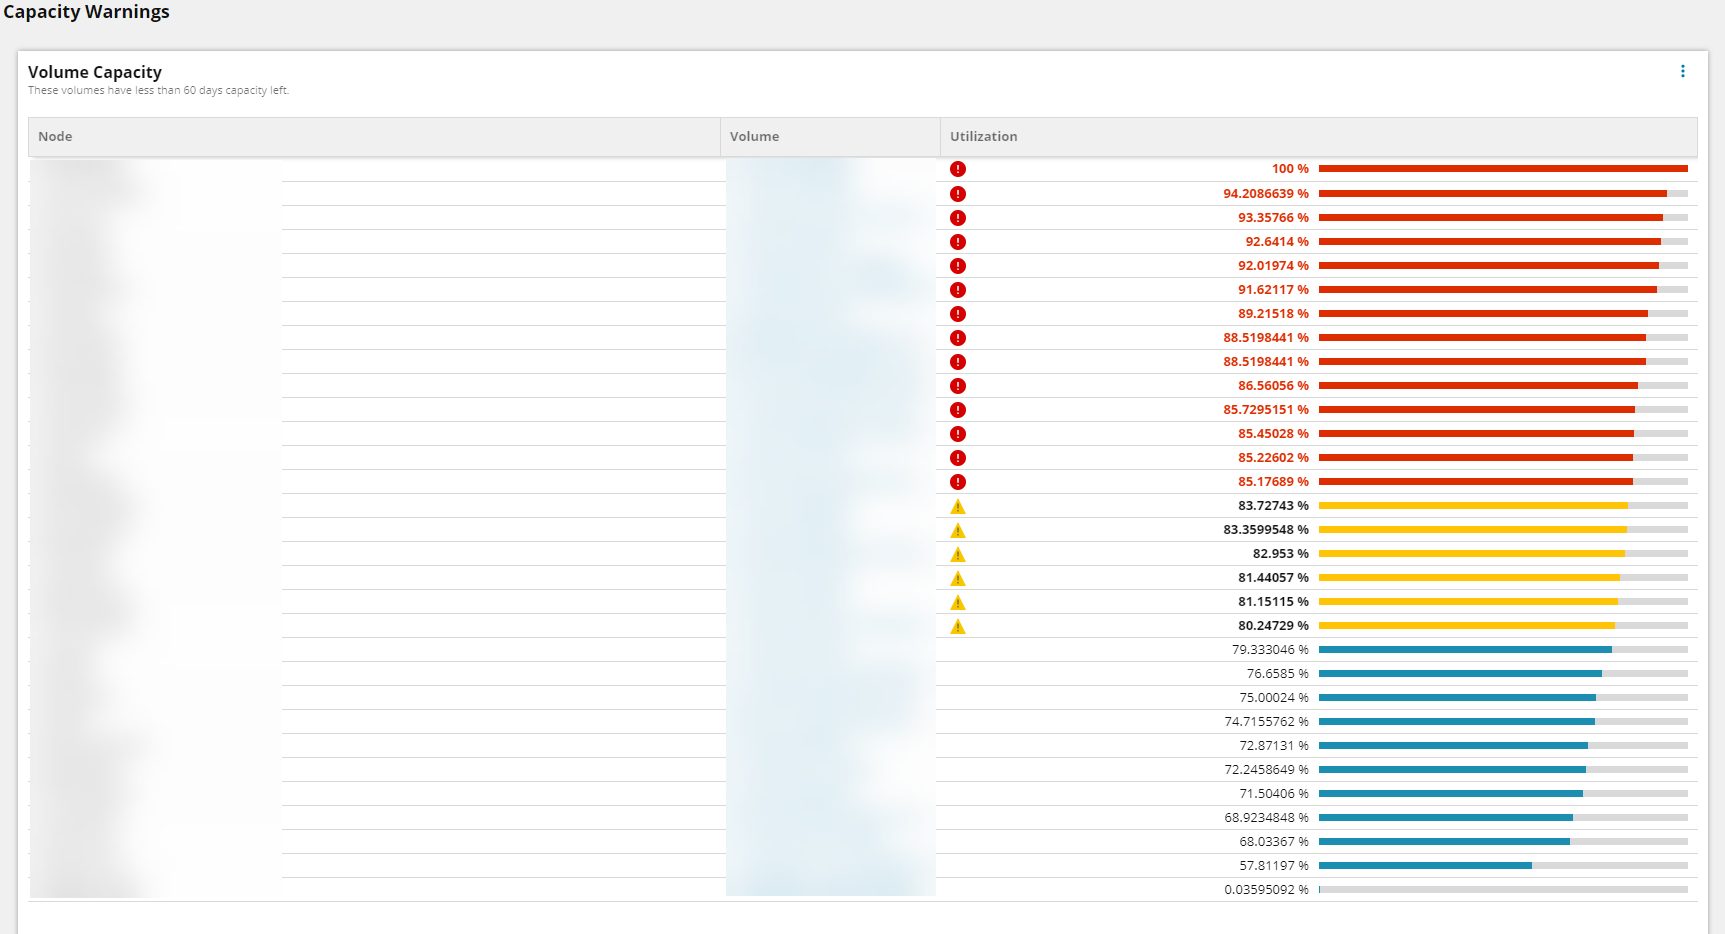
Sorted by percent used descending helps prioritize which drives need attention asap.
Here's the Swql needed:
select node.nodename,
       vfc.DetailsURL,
       vfc.DisplayName,
       vol.VolumePercentUsed
  from Orion.Nodes as node,
       Orion.Settings as s,
       Orion.VolumesForecastCapacity as vfc,
       Orion.Volumes as vol
       where node.Unmanaged = false
         and node.NodeID = vfc.NodeID
         and s.SettingID = 'ForecastMinDays'
         and vfc.DaysToCapacityAvg <= 60
         and vfc.MetricName = 'Forecast.Metric.PercentDiskUsed'
         and DayDiff(vfc.MinDateTime, vfc.MaxDateTime) >= isnull(s.CurrentValue, 7)
         and vfc.DisplayName != 'Physical Memory'
         and vfc.DisplayName != 'Virtual Memory'
         and vfc.DisplayName LIKE '%:%'
         and vfc.Volume.VolumeID = vol.VolumeID
ORDER by vol.VolumePercentUsed DESC
The rest of the table widget settings are as follows:
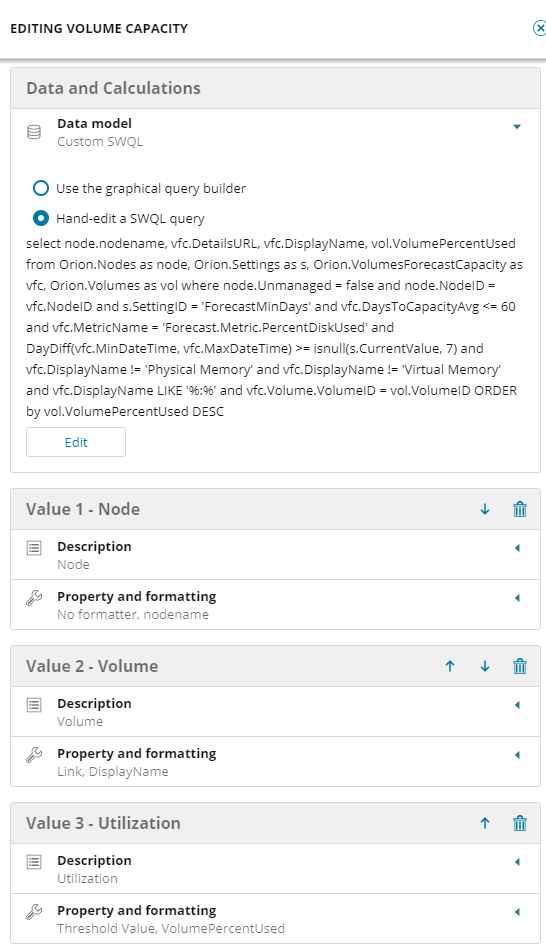
You'll note that the SWQL explicitly filters out vmdk paths and other virtualization only showing lettered drives. Feel free to edit that portion or the Memory exclusions as well.