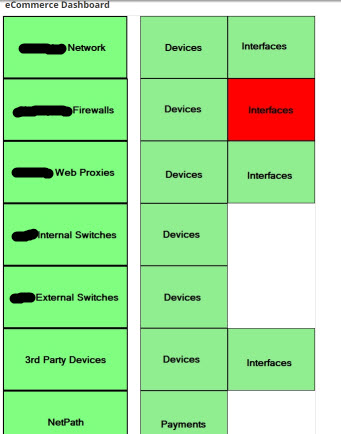
I've been asked to create a very high level dashboard view to go on a big screen so management can see a load of (hopefully) green boxes, so far Iv'e got the below working, on the left is just a description of what it is (I've blanked out a few names) then on the right you have devices and interfaces which go red when things go up or down depending on status.
What I wanted to add as more boxes on the right were other things like CPU and memory, Is there any way I can group the CPU status of a group of switches together in a box which will change colour if the CPU breaches a threshold?
I'm struggling to work out how to do it. Has anyone else done anything similar?