Hi @all,
can someone explain me, why there is a difference between the lines?
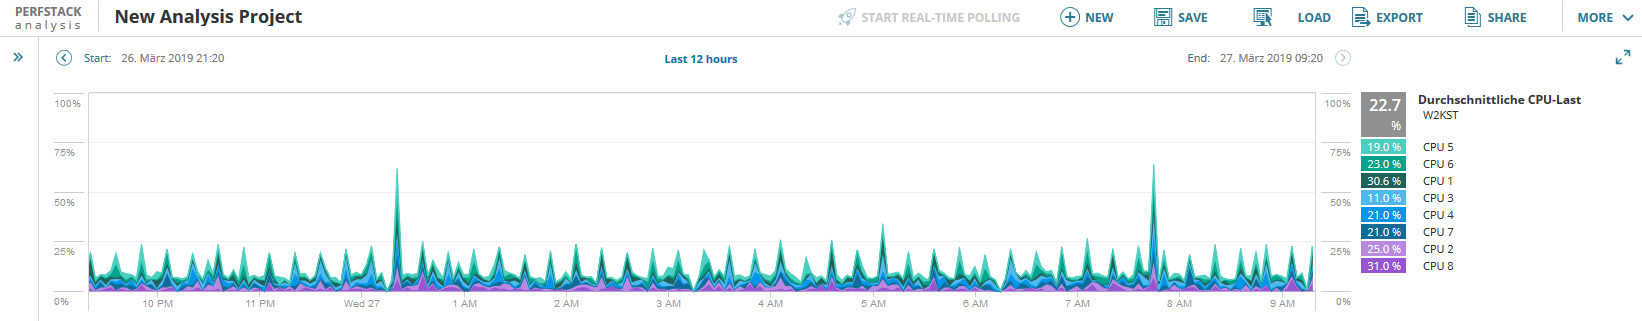
This is the same node and its the same chart:
Classic chart:

Modern chart:

Why is the cpu load not the same? Maybe a bug in the modern chart?
It is deffinetly the same node and the same timeframe.
Thanks