Hello Guys,
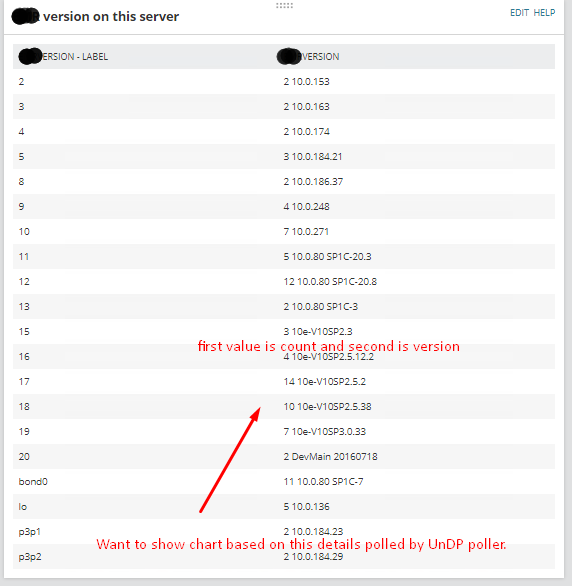
I have created custom Undp poller which gives me output like below in table format, I want to show is data in bar chart or any other chart.
For now we are creating charts in excel by manually exporting data, Help me to get this.
Unfortunately Orion doesn't have any built in support for any type of charts that don't have time as the X axis.
When I've done them before for clients we have had to use SQL Reporting. Javascript querying the web interface to populate charts is another technique that I've successfully experimented with but I'm not great at JS.