Folks :
I am quite new in Solarwinds, and I need to create an ALERT using a Custom SWQL Query. We have the lattest versions of Orion (2018.4), NPM (12.4), SAM (6.7.1) and a few other modules (not relevant here)
However, when I started testing the SWQL queries (following the advice from a lot of customer suggestions in THWACK) in SWQL Studio, I bumped into this huge Database structure, with no map on what to look for or where, nor the meaning of each field in the database :
SolarWinds Information Service v3.0 Schema Documentation Index
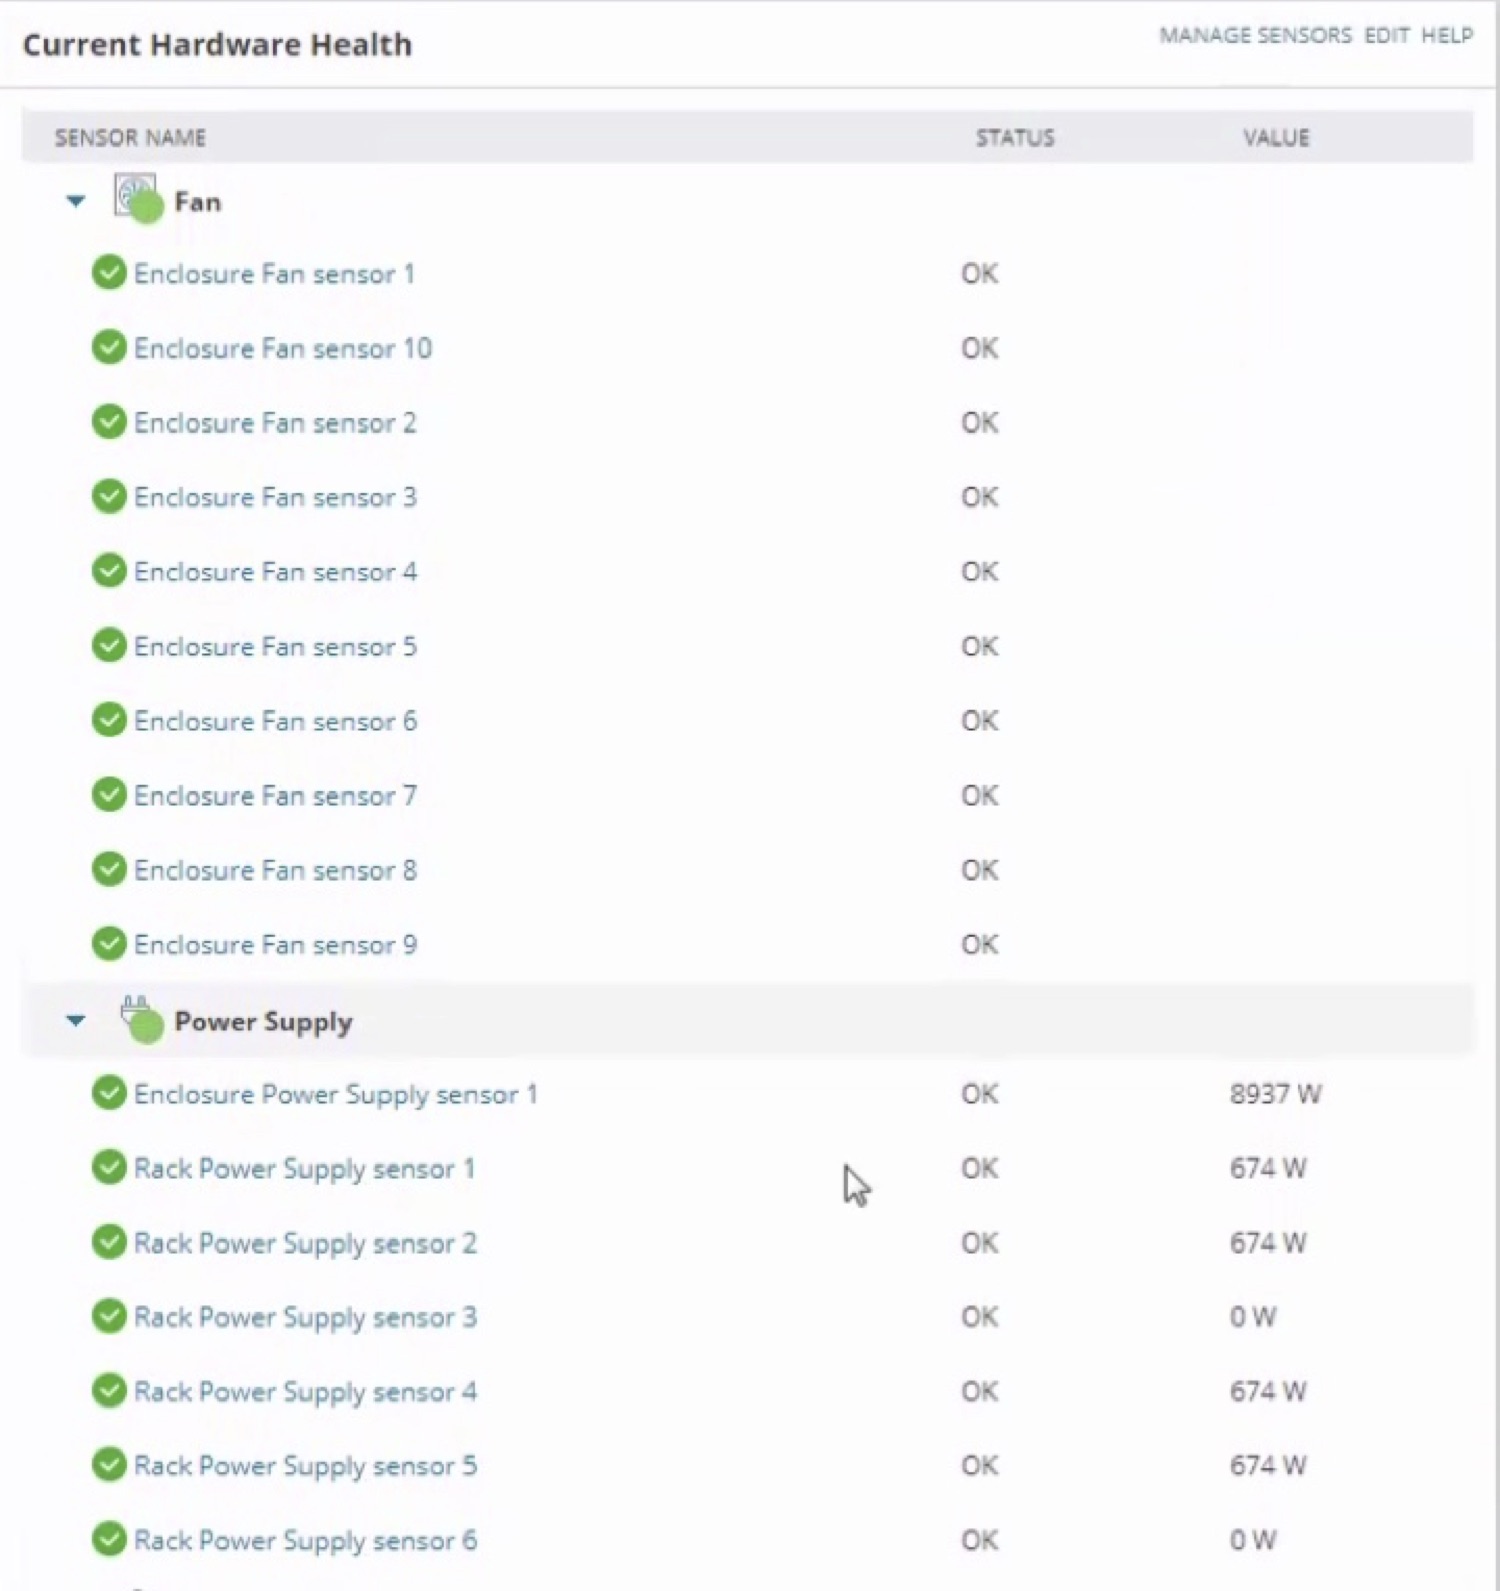
In our case, I need to monitor an HPc7000 (enclosure), and I find in the NODE VIEW the following information automatically filled (magically) by Solarwinds:
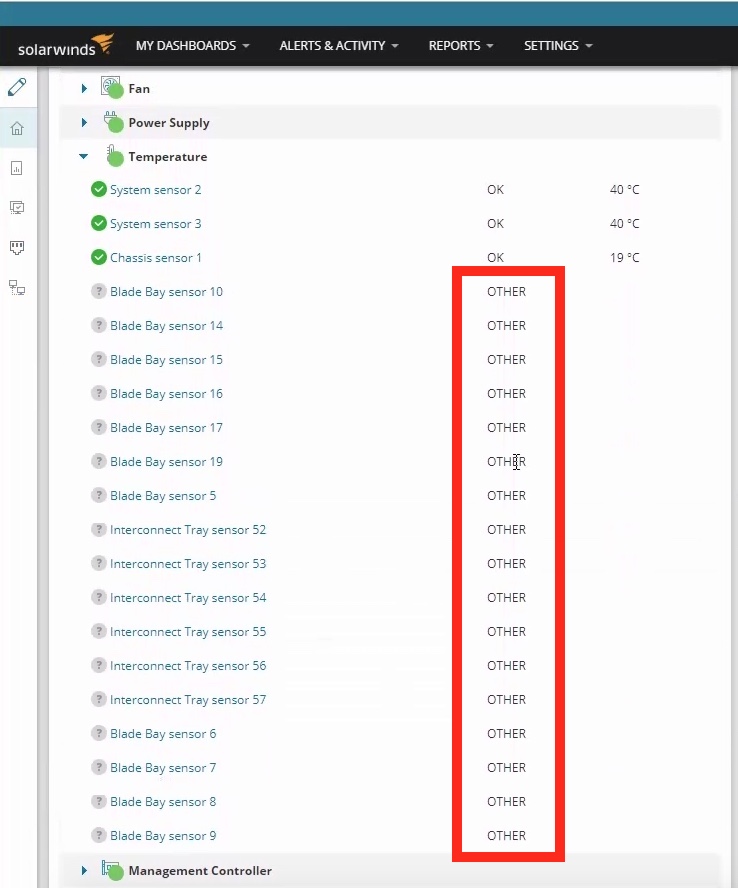
Which is great ... however, further down (in the same NODE VIEW) it seems that either Solarwinds can't find some information or the device SNMP agent could be reporting misleading information :
So, I have TWO questions :
1) How can I fix this "OTHER" information in Solarwinds ? I guess this magic is perfomed by some automation in Solarwinds that should be getting from the Enclosure something that Solarwinds translates as "OTHER". I need to understand what is it and how to make it right.
2) How / where I can find a decent explanation on the meaning of each field in the SWQL tables that I need to query in order to trigger an ALERT ? WHAT I NEED is to creat an ALERT based on the status of each HW component of the Enclosure. Since this status is already in Solarwinds (Node View) I don't need to create a Poller, right ?, so SWQL query seems the way to go ...
After a bit of testing with SWQL, I found this table "Orion.HardwareHealth.HardwareItem" that, apparently (my asumption, since there is no documentation on this), contains part of the information magically gathered by Solarwinds of my enclosure. In this table, the field "Value" seems to contain the Temperature measured (when the sensor is Temperature) or the WATTS (in the case of the Power Supply) and "OriginalStatus" seems to contain the "OK" status (when the sensor is OK).
Another table "Orion.HardwareHealth.HardwareInfo" includes the field "CategoriesWithStatus" includes a fairly long summary of the status of each component :
"Chassis (Up): Blade Chassis overall condition (Up)
CMC (Up): Enclosure Manager 4.85 sensor 1 (Up), Enclosure Manager 4.85 sensor 2 (Up)
Fan (Up): Enclosure Fan sensor 1 (Up), Enclosure Fan sensor 10 (Up), Enclosure Fan sensor 2 (Up), Enclosure Fan sensor 3 (Up), Enclosure Fan sensor 4 (Up), Enclosure Fan sensor 5 (Up), Enclosure Fan sensor 6 (Up), Enclosure Fan sensor 7 (Up), Enclosure Fan sensor 8 (Up), Enclosure Fan sensor 9 (Up)
Power Supply (Up): Enclosure Power Supply sensor 1 (Up), Rack Power Supply sensor 1 (Up), Rack Power Supply sensor 2 (Up), Rack Power Supply sensor 3 (Up), Rack Power Supply sensor 4 (Up), Rack Power Supply sensor 5 (Up), Rack Power Supply sensor 6 (Up)
Temperature (Up): Blade Bay sensor 12 (Unknown), Blade Bay sensor 13 (Unknown), Blade Bay sensor 14 (Unknown), Blade Bay sensor 4 (Unknown), Blade Bay sensor 5 (Unknown), Blade Bay sensor 6 (Unknown), Chassis sensor 1 (Up), Interconnect Tray sensor 52 (Unknown), Interconnect Tray sensor 53 (Unknown), Interconnect Tray sensor 54 (Unknown), Interconnect Tray sensor 55 (Unknown), Interconnect Tray sensor 56 (Unknown), Interconnect Tray sensor 57 (Unknown), System sensor 2 (Up), System sensor 3 (Up)"
An another field "CategoriesWithProblems" is empty, and I assume that this field could be populated by Solarwinds when "a problem with one of the sensors presents"
QUESTION : Is it so ? Are my assumptions correct ?
Where can I find some pointers on how to proceed to fix 1) and find a solution for 2) ?
Regards
Arturo