Is this normal? It's not a consistent 100% utilization. It more so seems like I get hammered with alerts at least 1 once per every hour with random servers (some use IIS, SQL, etc). We have over 80 servers in our virtual environment.
Provide a little more information. How are these VM's configured? When you get these alerts what's the vm showing? Are you seeing any spikes? How do you have the alert configured? This could also be in the way your monitoring the servers. Are they monitored in snmp, wmi, or agent monitoring?
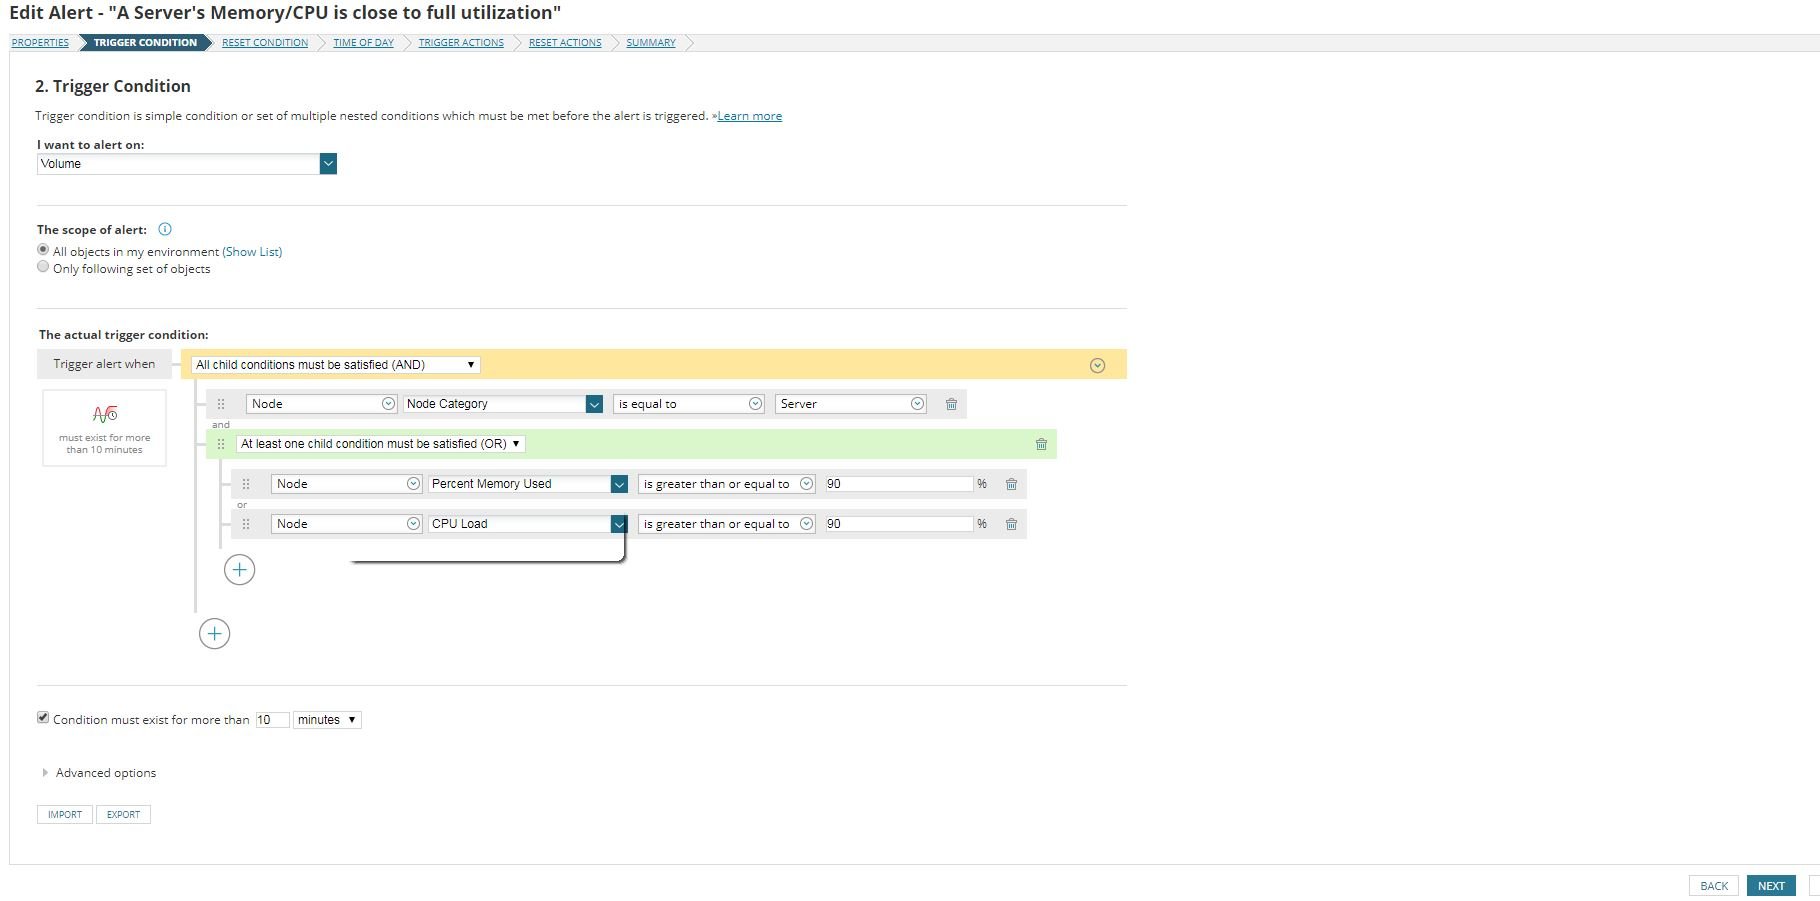
I use WMI for all of my windows servers. The attached screenshot is my trigger conditions. When I get the alerts sometimes the VM shows the cpu/memory is high. sometimes they dont. I do have agents configurd on them as well
I would say change *I want to alert on* to "Node" instead of "Volume" as this is more of a node related alert than it is a volume related alert. The condition at least to mean appears to be sound. And you have it set to be active for at least 10 minutes before firing an alert which normally should be enough to to avoid spikes.
In our environment we normally separate the alerts because I've had odd behavior like this as well trying to consolidate many things in one alert. Not that it wouldn't work, it might work just right for you but in our case we had alot of odd behavior happening and separated them.
Give this a try. See if this provides any better results.
Thanks. I'll give that a try. I wasn't sure if it was normal behavior for a server to shoot up to 100% almost every 30 minutes to an hour. Is this a problem where I need to up the resources? or just something servers do?