Hello,
I'm trying to figure out if I should be posting an Idea or just general discussion. I've decided to just start out as a discussion just in case I've not thought of all the possibilities to do what I'm trying to do.
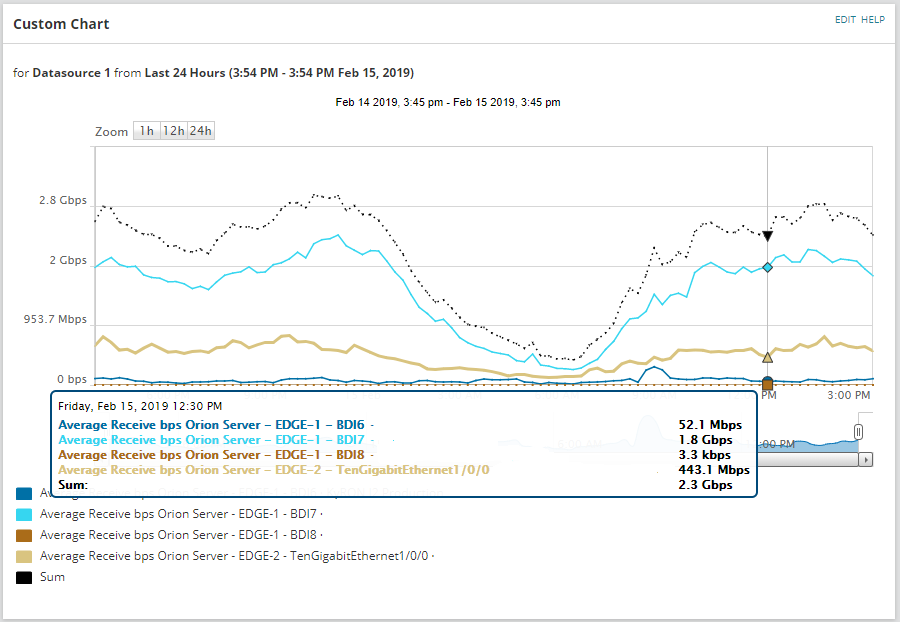
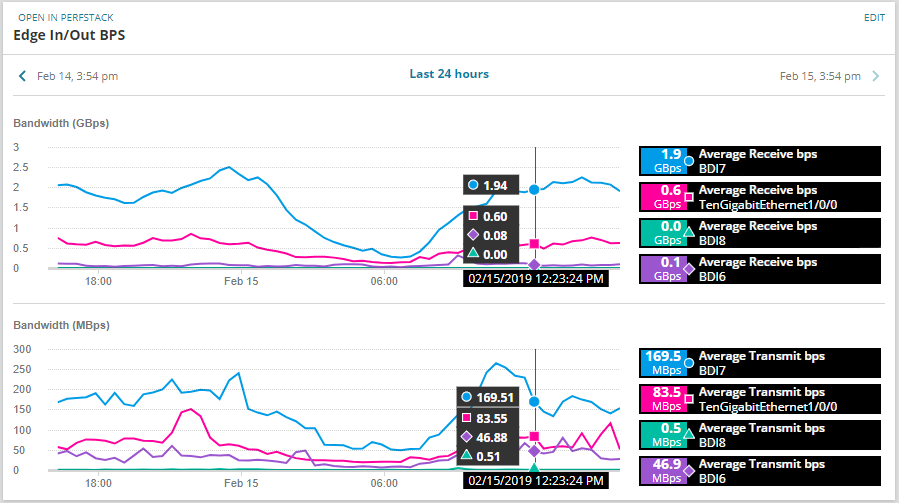
So, I've been playing around replacing some of my charts with PerfStack charts instead because it allows us a more direct path to more detail statistics. One of the items that I'm not seeing a good way to incorporate is summary/aggregate data. I have 4 peering's across 2 physical devices that I want to see total BW and while the old chart was capable of aggregating all the interfaces into a single summary line, that chart is just limited. PerfStack is "Pretty" and flexible, but doesn't appear to incorporate aggregation. I'd like to keep it, but I don't want to add the old chart to supplement the aggregation because it takes up a lot of real estate on the web page to have both. I'd be happy with a gauge that shows the most recent aggregate or a chart that showed just the aggregate. I'd like to see the below in the product because I just can't see a way to do them.
1. Add an option to aggregate/summarize a chart in Perfstack.
2. Add the ability to create an aggregate Gauge to show the last polled aggregate statistic for a group of interfaces.
3. Add the ability to create a custom chart that allows you to just show the aggregate statistic for a group of interfaces.
Does anyone know of ways to accomplish these things within the system?
Our Environment Versions:
NPM 12.4
Platform 2018.4
VNQM 4.5.1
SAM 6.7.1
NCM 7.9
VMAN 8.3.1
NTA 4.5.0
UDT 3.3.2
WPM 2.2.3