We've been tracking Cisco nodes that have problems when they are up for extended periods without reboots, reloads, upgrades, power outages, etc.
Certain Cisco nodes are notorious for becoming bricked if they are rebooted after their uptime exceeds some arbitrary period, and I've been trying to use NPM's reports to display nodes sorted by descending up time. Instead of getting what I expect, I find the report indicates none of my nodes have been up a long time.
I know several nodes have been up for two to four years.
Is there a limitation in NPM's Reports that prevents it from showing true up time if that time exceeds some value?
I've tried several variations of reporting:
First Try:
- New Report
- Custom Table
- Datasourc 1: Vendor = Cisco
- Name "Cisco Up Time Report
- Table Columns:
- System Up Time
- Caption
- Node ID (Hidden)
- Sort results by System Up Time - Node - Descending
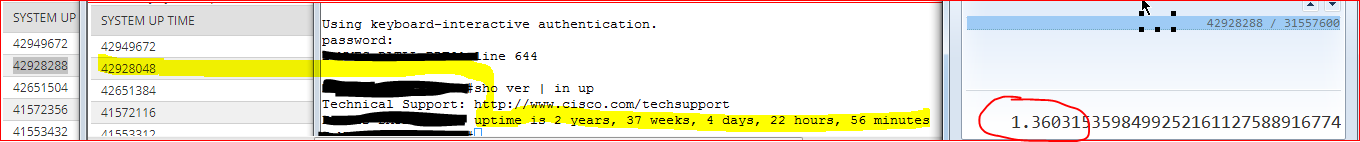
Using this format NPM Reports that a node has System Up Time of 42,928,048. Divide it by 31,557,600 (the number of seconds in a year) and NPM's Report says the up time is 1.36 years.
SSH into the node and issue the "sho ver | in up" command and the node says "uptime is 2 years, 37 week, 4 days, 22 hours, 56 minutes."
Why such a big discrepancy? Is there something in NPM that must be refreshed for the report to be accurate?
Second Try:
Using data from this thread: Re: Uptime Reporting
- New Report
- Custom Table
- Datasource 1: Vendor = Cisco
- Name "Cisco Up Time Report #2
- Edit Data Source
- Selection Method: Advanced Database Query (SQL, SWQL)
- SQL
SELECT
NodeID
,Caption
,Ip_Address
,DateDiff(hour,Nodes.LastBoot,GetDate()) AS HoursUp
,CONVERT(VARCHAR(40), DATEDIFF(minute, Nodes.LastBoot, GETDATE())/(24*60))
+ ' days, '
+ CONVERT(VARCHAR(40), DATEDIFF(minute, Nodes.LastBoot, GETDATE())%(24*60)/60)
+ ' hours, and '
+ CONVERT(VARCHAR(40), DATEDIFF(minute, Nodes.LastBoot, GETDATE())%60)
+ ' minutes.' AS 'Time Up'
FROM [Nodes]
ORDER BY 5 DESC
- Table Columns:
- System Up Time
- Caption
- Node ID (Hidden)
- Sort results by System Up Time - Node - Descending
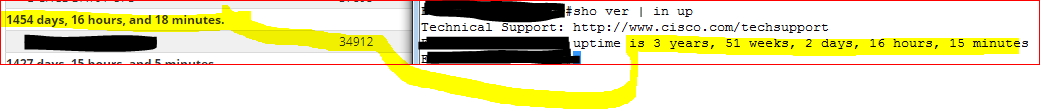
I believe these results.
My questions to you:
1. Why doesn't the first report show accurate up time data?
2. How can I adjust the second report to show year/months/weeks/days/hours/minutes the way the Cisco node reports it?
3. I'd like to edit the SQL query to display only Cisco and Juniper nodes. I imagine some query syntax can accomplish the equivalent of "Vendor=Cisco OR Vendor=Juniper", but I don't know what that syntax might be. Can you help with that?
Swift Packets to you & your customers!
Rick Schroeder