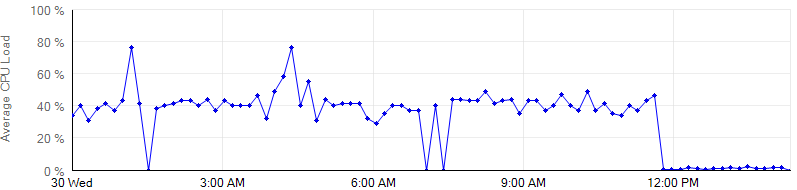
Our NPM 11.5.2 environment reported a significant change in average CPU utilization for one of our Windows Server 2008 VMs monitored via WMI (past few weeks shown below). However, if you log into this server directly it still shows <5% CPU. Also, the reported CPU increase happened immediately following the weekly scheduled reboot of our SolarWinds servers.
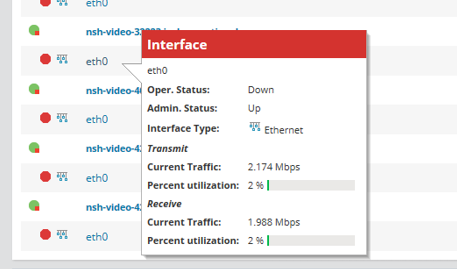
We have multiple NPM 11.5.2 environments, so I setup two of the others to monitor the same server - one via WMI and one via SNMP. They both accurately showed <5% CPU while our original SolarWinds environment still showed around 40%. I went back to our original SolarWinds environment and changed the polling interval from 10 minutes to 1 minute for more granularity. As soon as I made this one simple change, it started reporting the correct value (shown below just before 12:00 PM).
I'm concerned about why this happened because it calls the data for our many servers into question. Anyone else encountered this or have some theories?