For 10.6
What's new.
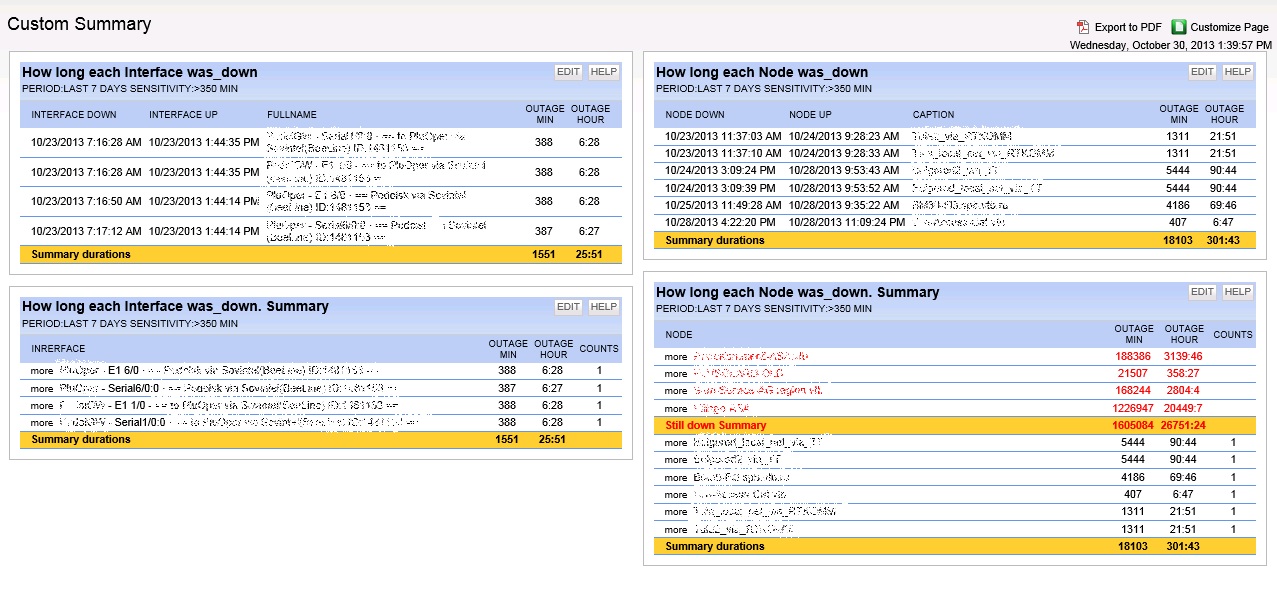
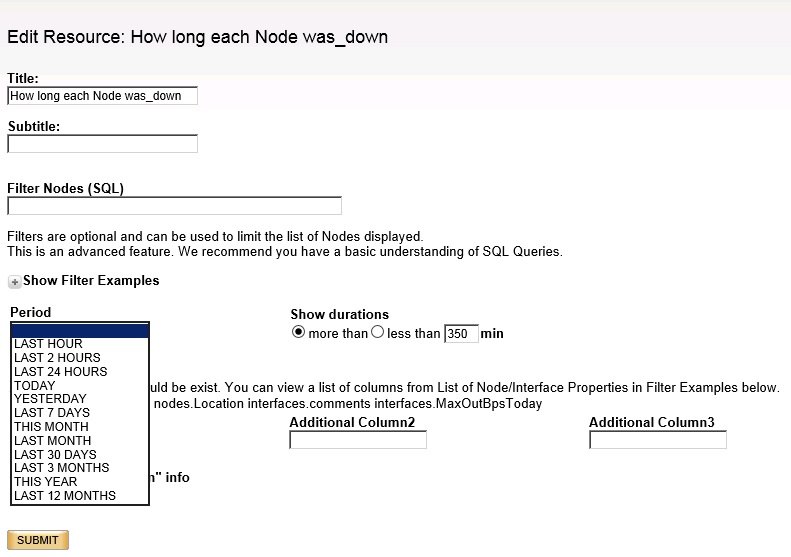
Relative time period
Show durations more or less selected value.
http://thwack.solarwinds.com/docs/DOC-121942
Message was edited by: Gob
Thanks! Another sweet addition. Nice job Gob!
I am having a problem trying to figure out where to place the files. I am using a Windows server 2003 but the admins would not leave enough space on drive 'C:\' for the website. There I have the website built on drive \. The directory path for the website is\dmnpm web\Orion. We are currently running the Orion 8.5.1 relase.
What I have tried up to now is editing the legacyProxy.config file which is located in thed:\dmnpm\Orion\ directory. After adding the lines in the readme.txt file all of the maps that my customers were viewing went blank and did not come back until I removed those 4 lines.
I have also placed the files from the C--InetPub--Solarwinds--NetPerfMon--Resources--1-1--SummaryReports folder into the 'd:\dmnpm web\NetPerfMon\Resources\1-1 Summary Reports folder'
I have also placed the C--InetPub--SolarWinds--NetperfMon files in the\dmnpm web\NetPerfMon\ folder.
The layout and presentation of the Summary page for the outages looks very good and I would like to correct the problem I have if possible. Any suggestions on what I can do to solve my problem of not being able to view the sumamry page or blanking the other pages out would be greatly appreciated.
Thanks this is up and working like a champ.
A couple of questions since I am no SQL guru,
How do I limit the time frame from 8 am to 5 PM Monday through Friday?
How can I filter switch interfaces for user PC's that are not critical to the switch being up?
I am unable to find the "legacyproxy.config file. I have the c:\inetpub\solarwinds directory, but no Orion in it. I have even done a search for the file and haven't been able to find it.
could it be named something else?
This summary page looks great! I would really like to display it on our Orion setup. I am having trouble setting it up though. Added the legacyproxy.config lines, and moved the oher files to the proper directories, but I do not see any new resources available to add to my web views. I am looking under the summary tab, and I only see the default views available.
Any assistance would be greatly appreciated.
I am having the same issue. I have put all the files in the correct place, but I cannot find where to look at them, where to add them, etc.
Any information would be appreciated.
Thanks,
S
http://thwack.com/photos/customized_maps/picture41385.aspxTry this
#1 Click Admin#2 Manage Views#3 Add new summary page#4 Click "+" to add a Resourses#5 Add my resourses
#6 Click Preview#7 On Preview page add custom parameters(You must click Edit button) to each resourse
http://thwack.com/photos/customized_maps/picture41386.aspx#8 Enjoy
If You do not like edit a legacyProxy.config do not do this.
if you do not see my resourses try to change permissions for my files
http://thwack.com/photos/customized_maps/picture41383.aspx
Message was edited by: Michael Torok I apologize for the broken links here. Some pictures seem to have been missed during our migration March 2012. This looks like it was a procedure on how to add a custom resource to NPM. You can find that information here, also: http://www.solarwinds.com/NetPerfMon/SolarWinds/wwhelp/wwhimpl/js/html/wwhelp.htm#href=OrionCoreAGEditingViews.htm.
This is great, what I'm looking for is a report that will be e-mailed. However I've run into some questions.
For starters, I'm using the node query that uses a single line for each event, it suits my needs. Secondly, I'm using a custom field to make sure that I only see routers at remote locations, not individual servers. Lastly, I've added eventtime so that I can see when the outage occured. There is where my problem lies.
I'd like to sort by eventtime. Also, is there anyway to run a report out of this in Report Writer? Thanks for making this, its very helpful. Heres my settings for reference:
Hi. If you want to sort by eventtime you must use "How Long Each ***was down". NOT Summary. In Summary It does not make sense. Example How Long Each Node was downrouterA 10.02.2009 11:10 10minrouterA 10.02.2009 12:10 20minrouterA 10.02.2009 13:10 13minrouterB 10.02.2009 13:15 17minrouterB 10.02.2009 14:15 03min How Long Each Node was down.Summary.routerA 33minrouterB 20min In Summary you’ll see the last eventtime only: 10.02.2009 13:10 for routerA and 10.02.2009 14:15 for routerB SQL query for How Long Each Node was down. You can add it into ReportWriter---!!!!!!!!!!!!!!!!!!!!!!!!!!set dateformat dmy---!!!!!!!!!!!!!!!!!!!!!!!!!!declare @period smallintdeclare @periodbegin datetimedeclare @periodend datetimedeclare @Sensitivity smallint--Add here Sensitivity (min), period(days) or periodbegin/periodend==========set @Sensitivity=10set @period=';'set @periodbegin=';20-02-2009'set @periodend=';01-03-2009'--======================================================================if @period!=''beginset @periodbegin=(GetDate()-@period)set @periodend=getdate()endif @periodend=';' set @periodend=getdate()SELECTStartTime.EventTime,(SELECT TOP 1 EventTime FROM Events AS Endtime WHERE EndTime.EventTime > StartTime.EventTime AND EndTime.EventType = 5 AND EndTime.NetObjectType = 'N' AND EndTime.NetworkNode = StartTime.NetworkNode ORDER BY EndTime.EventTime)AS UpEventTime, Nodes.Caption,------------------------------Add here another column---------------------address, ------------------------------------------------------------------------ DATEDIFF(Mi, StartTime.EventTime, (SELECT TOP 1 EventTime FROM Events AS Endtime WHERE EndTime.EventTime > StartTime.EventTime AND EndTime.EventType = 5 AND EndTime.NetObjectType = 'N' AND EndTime.NetworkNode = StartTime.NetworkNode ORDER BY EndTime.EventTime))AS OutageDurationInMinutes FROM Events StartTime INNER JOIN Nodes ON StartTime.NetworkNode = Nodes.NodeIDWHERE(StartTime.EventType = 1) AND(StartTime.NetObjectType = 'N') AND (---------------------------------period--------------------- EventTime > @periodbegin AND EventTime < @periodend ----------------------------------------------------------------------------------- )and (DATEDIFF(Mi, StartTime.EventTime, (SELECT TOP 1 EventTime FROM Events AS Endtime WHERE EndTime.EventTime > StartTime.EventTime ANDEndTime.EventType = 5 AND EndTime.NetObjectType = 'N' ANDEndTime.NetworkNode = StartTime.NetworkNode ORDER BY EndTime.EventTime)))--------------------------------------Sensitivity (min)----------------------- > @Sensitivity---------------------------------------Add here another filter----------------------- and caption like '%pix%'------------------------------------------------------------------------------------- ORDER BY StartTime.EventTime asc--ORDER BY caption asc--ORDER BY OutageDurationInMinutes desc SQL query for How Long Each Interface was down. You can add it into ReportWriter too.---!!!!!!!!!!!!!!!!!!!!!!!!!!set dateformat dmy---!!!!!!!!!!!!!!!!!!!!!!!!!!declare @period smallintdeclare @periodbegin datetimedeclare @periodend datetimedeclare @Sensitivity smallint--Add here Sensitivity (min), period(days) or periodbegin/periodend==========set @Sensitivity=10set @period=';'set @periodbegin=';20-02-2009'set @periodend=';01-03-2009'--======================================================================if @period!=''beginset @periodbegin=(GetDate()-@period)set @periodend=getdate()endif @periodend=';' set @periodend=getdate()SELECTStartTime.EventTime,(SELECT TOP 1 EventTime FROM Events AS Endtime WHERE EndTime.EventTime > StartTime.EventTime AND EndTime.EventType = 11 AND EndTime.NetObjectType = 'I' AND EndTime.NetworkNode = StartTime.NetworkNode ORDER BY EndTime.EventTime)AS UpEventTime,------------------------------Add here anoter column---------------------Nodes.Caption,--address,------------------------------------------------------------------------ cast (StartTime.Message as varchar(255) ) as Message,DATEDIFF(Mi, StartTime.EventTime, (SELECT TOP 1 EventTime FROM Events AS Endtime WHERE EndTime.EventTime > StartTime.EventTime AND EndTime.EventType = 11 AND EndTime.NetObjectType = 'I' AND EndTime.NetworkNode = StartTime.NetworkNode ORDER BY EndTime.EventTime))AS OutageDurationInMinutesFROM Events StartTime INNER JOIN Nodes ON StartTime.NetworkNode = Nodes.NodeIDWHERE(StartTime.EventType = 10) AND(StartTime.NetObjectType = 'I') AND (---------------------------------Add here period (days)--------------------- EventTime > @periodbegin AND EventTime < @periodend -----------------------------------------------------------------------------------) and (DATEDIFF(Mi, StartTime.EventTime, (SELECT TOP 1 EventTime FROM Events AS Endtime WHERE EndTime.EventTime > StartTime.EventTime ANDEndTime.EventType = 11 AND EndTime.NetObjectType = 'I' ANDEndTime.NetworkNode = StartTime.NetworkNode ORDER BY EndTime.EventTime)))--------------------------------------Sensitivity (min)----------------------- > @Sensitivity---------------------------------------Add here another filter----------------------- and caption like '%pix%'------------------------------------------------------------------------------------- --ORDER BY StartTime.EventTime asc--ORDER BY caption asc--ORDER BY OutageDurationInMinutes desc--ORDER BY Message asc
this is really great work Gob!
thank you very much!
Thanks again Gob, I believe I can do what I need with your SQL Query, however I'd like to see what you can do first. Here's why I'm using the summary report instead of the standard report.
Standard Report:
Summary Report:
Maybe I sound a little too picky, but the summary report can fit an entire page of data, where the standard report you have to scroll down to receive the same amount of data. The end time and start time really aren't necessary. Nor is the second that the event started or ended.
If I could just see "Node Down Time:", then "Duration", that would be optimal. If you Expand the "Node Down Time", then it would all fit on one line, be sorted by node down time. And meet all my needs.
Let me know what you think.
Good Job GOB. Thanks for sharing man! May I request somethin like a Graph of the report?
Hi Gob.. this is fantastic... But... For some reason I only see a few items from yesterday... Even if I go out 90 days I only get a handful of entries, the same entries, every time I run it.
Any thoughts??
NEVERMIND.... Only was storing the last 1 day of events... DUH!! I am inheriting this system from a previous admin...
Reports are Awsome!! Thanks!!!
GOB:
i've been trying to understand how to use custom date ranges in your SQL queries and need your help.
i only want to report on a Custom Period, for instance, Feb 2009, how would i alter your SQL query for this peiod ( EventTime BETWEEN 39843 AND 39870 )?
thanks.
Hi. It not provided in this resource. But you can do it in my SQL queries on previous page. I have corrected it and you can use a custom period.
Good luck
Hi Gob,
I am having pixsyslog server ,problem is this i have to continue monitoring the devices whether logs are comming or not.can u provide me any help so that whenever some devices is not logging it should send me mail notification for device outage.
"Thanking you in anticipation "
This report based on events from devices. Yes, you should monitor the devices to receive the up/down events from it.You can to configure the Report Scheduler to send a report via email.
Where is the setting for how many days of events to keep?
Thanks
Great tool,
The question I have is in using this as a report.
I am wanting to use the report for down interfaces, and add a colume and filter from the interface database (custom field) Is this posible now or with some tweeking? I have not been able to make it work.
In my case I only want to report on down primary WAN circuits not backups, and I have interfaces marked as such.
I am not able to see the resources listed in the resource list, under summary Reports. I have checked the file permissions on all of the files provided. All permissions are the exact same as all the default asp and resource files that came with orion. Also double checked the folder locations. All seem to be correct. Any idea on what I am missing?
Hi All. I finally rewrote it on DOTNET, but it's still beta and not all features rewritten. Tested on NPM v10SP1Enjoy.
Looks great GOB!
Thanks for this great work!!!
I have a question please. Is it as simple as this change to get the real interface FULLNAME which gets me a little more description for the interface.
To CHANGE
InterfaceName='<%#Eval("InterfaceName")%>'>
to
Because, for me this output is either...
Fullname
HQ_1stFloor3560-GigabitEthernet0/1 · Trunk to Core
or else InterfaceName
GigabitEthernet0/1
FullName='<%#Eval("InterfaceName")%>'>
Added-custom columns
Fixed -interface.Fullname
updated. Now it's a stable version. Added summary info, stilldown info, additional info for Summary resources, small bugfixed
Great information thanks for sharing with us.In fact in all posts, their is something to learn.
Payday Loans
Hi Sir,
Sorry about this question, I'm just new to this system and I need to create a script for a report. The good thing is you already have done it, so I'm trying to study your codes/queries for our report. (I already assumed that the period, periodbegin and periodend are for the query to search and compute of the downtime of nodes/interfaces for a given range/amount of time) I just don't know what the Sensitivity is for.
Thanks...
This report will show the Nodes that Outage Duration more than Sensitivity.
If you want to use this queries for a Reports you should create User Defined Function hhmm first. It provide translate durations from mm format to hh:mm.
Just run query called !!You should create this function first.sql from SQL folder.
Just want to confirm, is the Sensitivity is used like:
If the Sensitivity is 2 minutes, the result will be the downtime computation for for nodes within the given range with all downtime duration greater than 2 minutes and those with downtime duration less than 2 minutes will be excluded from the result.
We need a different column/field layout to the report so we need to incorporate your script's computation to our report. We created the required function first and we tried your "solarwinds node durations.sql" in report writer and it works perfectly.
Yes, thats right.
attn CS_BALIW_CS
Is it possible for you to publish the finished SQL report contents in this post? This would make a great addition. Thank-you!
Ok I've got an interesting problem with this. I'm running NPM on a windows 2008 R2 server and I'm running an additional web server that runs on windows 2003 R2 server. I've copied the Inetpub files to both servers as specified and I've unblocked each file. I then created a sumamry view called Interface_Node Down Time. Then I went to add these resources using the Resource called Summary Reports - Various Reports Showing Problem Areas. The new resources show up on the main NPM server but not on the Additional web server. So any one have any ideas on how to get them to show up on the additional web server? I've stoped and started the server several times as well as recopied the files again and still no joy.
The Native Folder structure for a Add'l Web Server is different than that of the Default Web Server (Primary Poller), has anyone made this function on an addditional Web Server? The interface resource seems to be the difference.
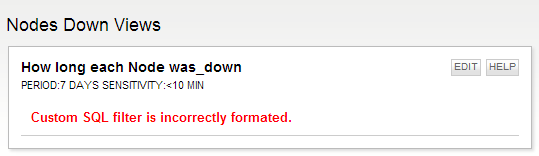
I tried testing your resource on our 10.5 and it works great. I can now see all nodes that went down for 10 minutes and more. However, I also want to see nodes that went down for a duration of 1 - 9 minutes or less than 10 minutes. We want to tag this as Intermittent nodes or interfaces. Is it possible to create an argument under the "sensitivity" say < 10?
Cheers
Hi. It's easy. Just press Edit Button on the header of this resource.
I tried creating sensitivity "< 10" less than 10 minues but I get an error
Custom SQL filter is incorrectly formated.
Would it also possible to filter the events that occur between a range of time? ie 9AM - 5PM?
Hi. Try 10, not <10
If I input 10 it is ok. It would get those events where the node went down with 10 minutes or more. However we would also like to display all those event that went down below 10 minutes ( 9 minutes and below). We want to treat them as "intermittent".
Another one is to filter the events that happened in between time periods (08:00 - 17:00) or business hours.
Cheers,
Hi. Open the .ascx.cs documents.
Find the >@Sensitivity filds
Replace with <@Sensitivity
It may be with space, like this > @Sensitivity
I can't create filter for business hours right now, too many modification need.
I've copied the files into my directory but the resources are not showing up. I'm on 10.6 at the moment and used the files from the 10.6 folder in your download. Any suggestions would be welcome
- Nick
nickzourdos
Did you run the configuration wizard, selecting the option for "website", after you copied the files?
If not, you might want to try that.
If you have already done that, and it is still not working, then, unfortunately, I do not know what else to tell you.
Hope it helps...
That actually broke my web console
Luckily I made a backup beforehand. After I restored it, this resource popped up! It has been intermittent in the past so let's hope it's here to stay!
Out of curiosity, has anyone tested this with NPM v10.7 yet? I would really like to implement this into my environment and want to make sure it will work before committing to the change. Excellent work either way, Gob!!!!!
Come on, there has to have been someone that's installed this with the latest version of NPM......anyone used this with NPM 10.7+ yet?
Where does this resource store its data? I had to reinstall Orion and I am missing the last 12 months worth of outage information.
Thanks in advance.
Does anyone know if this works with the latest version?
Or is there an update out for it?
Great query that I really would like to use. Running NPM 11.0.1
idk this is a serious blast from the past you are looking at... I suppose if you can try pasting the SQL into the report writer and see if you can get any results... a few of the table names may have changed but my guess is it's still pretty workable from glancing over it. I used to use this resource back 5 years ago lol!
I'm new to SolarWinds and trying to build a NOC for our company. I spotted the datestamps on this and realised it was old, but was hoping someone knew how to get it to work as this is exactly what we need!
This resource "sort of" works in NPM 11.5.2. It took my web console a few tries to get the resource to load into my views. I had to run the config wizard a few times, and re-copy the files to INETPUB. Eventually something caught hold and the resource in my views showed up, but I can't actually add the resource manually because it doesn't show up in the search when customizing a page. It is very strange.
Hi all! Who added this report to NPM 12? What do you change, if yes?
Best regards, Asset
Didn't work for me. I had to remove this resource. I can't believe Solarwinds hasn't developed a resource like this. After all these years! It the most useful of all summary resources and we used it extensively.
I have my own personal wish list of resources that I pray the devs would build for me so I can appreciate the sentiment. In the mean time, you can build most of the same capabilities with SWQL queries if you learn how to do them or snag them from the Thwack community.
I don't have time to rework the queries for Interfaces right now, but here are some quickly put together equivalents to the Node Downtime resources here that seem to be no longer operational.
Downtime of Nodes currently Down
SELECTn.caption as Node,n.detailsurl as [_linkfor_Node],'/Orion/images/StatusIcons/Small-' + StatusIcon AS [_IconFor_Node],n.ip_address as [IP Address],n.detailsurl as [_linkfor_IP Address],ToLocal(n.LASTSYSTEMUPTIMEPOLLUTC) as [Last Polled],round((minutediff(n.LASTSYSTEMUPTIMEPOLLUTC,getutcdate())/60.0),1) as [Down Hours]from orion.nodes nwhere status=2--and caption like '%${SEARCH_STRING}%'
Or if you are looking for all the down periods during the previous 7 days
SELECT -- Device name StartTime.Nodes.Caption AS [Device] -- This will generate the status icon to the left of the device name ,'/Orion/images/StatusIcons/Small-' + StartTime.Nodes.StatusIcon AS [_IconFor_Device] ,starttime.nodes.detailsurl as [_linkfor_Device] -- I found that the 'Message' column was too wide for my purposes and opted to remove it -- If you want it in your resource, just remove the comment marker (--) from the line below --,StartTime.Message -- Down Event time stamp in local time zone ,ToLocal(StartTime.EventTime) AS [Down Event] -- Up Event time stamp in local time zone ,(SELECT TOP 1 ToLocal(EventTime) AS [EventTime] FROM Orion.Events AS [EndTime] WHERE EndTime.EventTime >= StartTime.EventTime AND EndTime.EventType = 5 AND EndTime.NetObjectType = 'N' AND EndTime.NetObjectID = StartTime.NetObjectID AND EventTime IS NOT NULL ORDER BY EndTime.EventTime ) AS [Up Event] -- Downtime duration in minutes. Based on either the current time (node is still down) or Up Event time (node is back up) ,CASE WHEN (SELECT TOP 1 ToLocal(EventTime) AS [EventTime] FROM Orion.Events AS [EndTime] WHERE EndTime.EventTime >= StartTime.EventTime AND EndTime.EventType = 5 AND EndTime.NetObjectType = 'N' AND EndTime.NetObjectID = StartTime.NetObjectID AND EventTime IS NOT NULL ORDER BY EndTime.EventTime) IS NULL THEN MINUTEDIFF(StartTime.EventTime, GETUTCDATE()) ELSE MINUTEDIFF(StartTime.EventTime, (SELECT TOP 1 EventTime FROM Orion.Events AS [EndTime] WHERE EndTime.EventTime > StartTime.EventTime AND EndTime.EventType = 5 AND EndTime.NetObjectType = 'N' AND EndTime.NetObjectID = StartTime.NetObjectID ORDER BY EndTime.EventTime)) END AS [Minutes]-- This is the table we are queryingFROM Orion.Events StartTime-- EventType = 1 is to correlate with our 'Down Event' time stamp from line 13 aboveWHERE StartTime.EventType = 1and daydiff(starttime.eventtime,getdate())<7--AND StartTime.Nodes.caption like '%${SEARCH_STRING}%'-- Order our results from the newest to oldest 'Down Event'ORDER BY [Down Event] DESC
-Marc Netterfield
Loop1 Systems: SolarWinds Training and Professional Services
Brilliant! This is excellent work. Since I'm decidedly not an expert in SQL or SWQL, is it possible to modify the "last 7 days" query to only display nodes based on a condition (custom properties, machine type, vendor, etc)? Scratch that! I see you included that option at the bottom of the query My next question would be if it's possible to only show events that last over a certain amount of time?
I know this is an old thread but how can filter this to show only a certain device type?