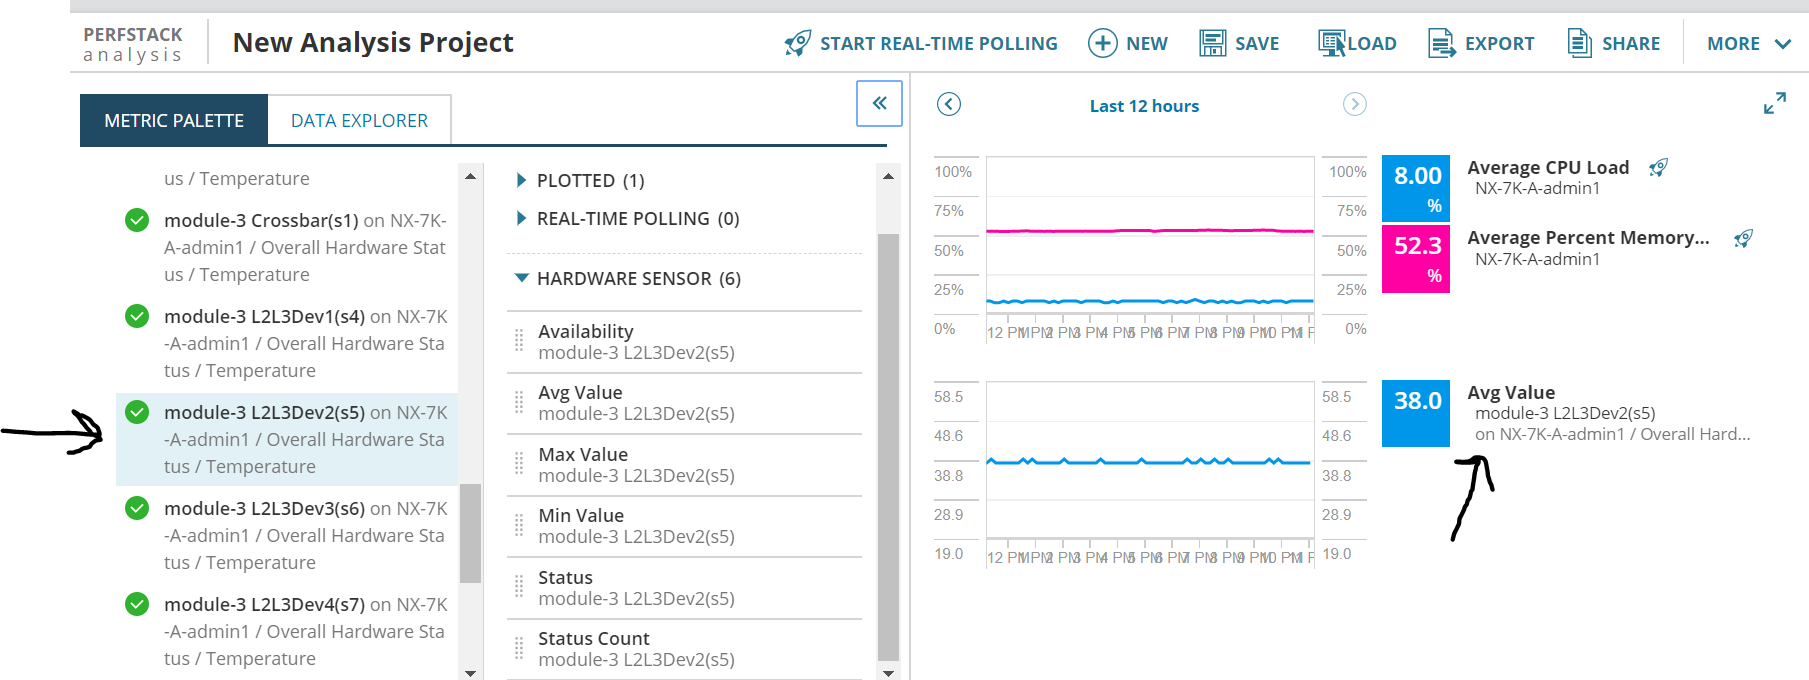
Anyone know of a way to customize this chart? I only need to see one temperature sensor, the module-1 FRONT. But a Nexus has tons of sensors, they overflow the default setting of 10 components, so I am not able to view the graph of the sensor I am interested in. The chart is already ridiculously tall, so increasing it above 10 is not a good idea.
What I really need is a way to create custom graph definitions for any datapoint, the way I can in Zenoss. Any hints greatly appreciated.