Hi All,
I am seeing very odd behavior for Linux servers configured via SNMPv2. Below screenshots with details:
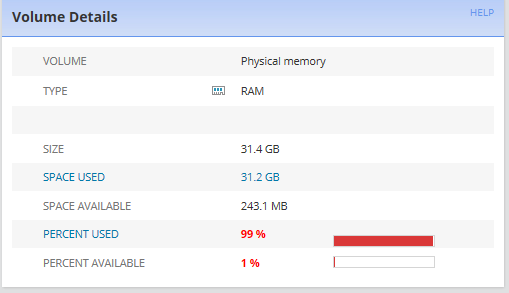
Cache, Shared and physical memory is showing 99%
Whereas the radial gauge is showing that total memory used is only 16%...
Another screenshot for type RAM:
I am seeing this across multiple nodes. So any reason why its showing different? Is it calculated separately? OR there is something seriously wrong?
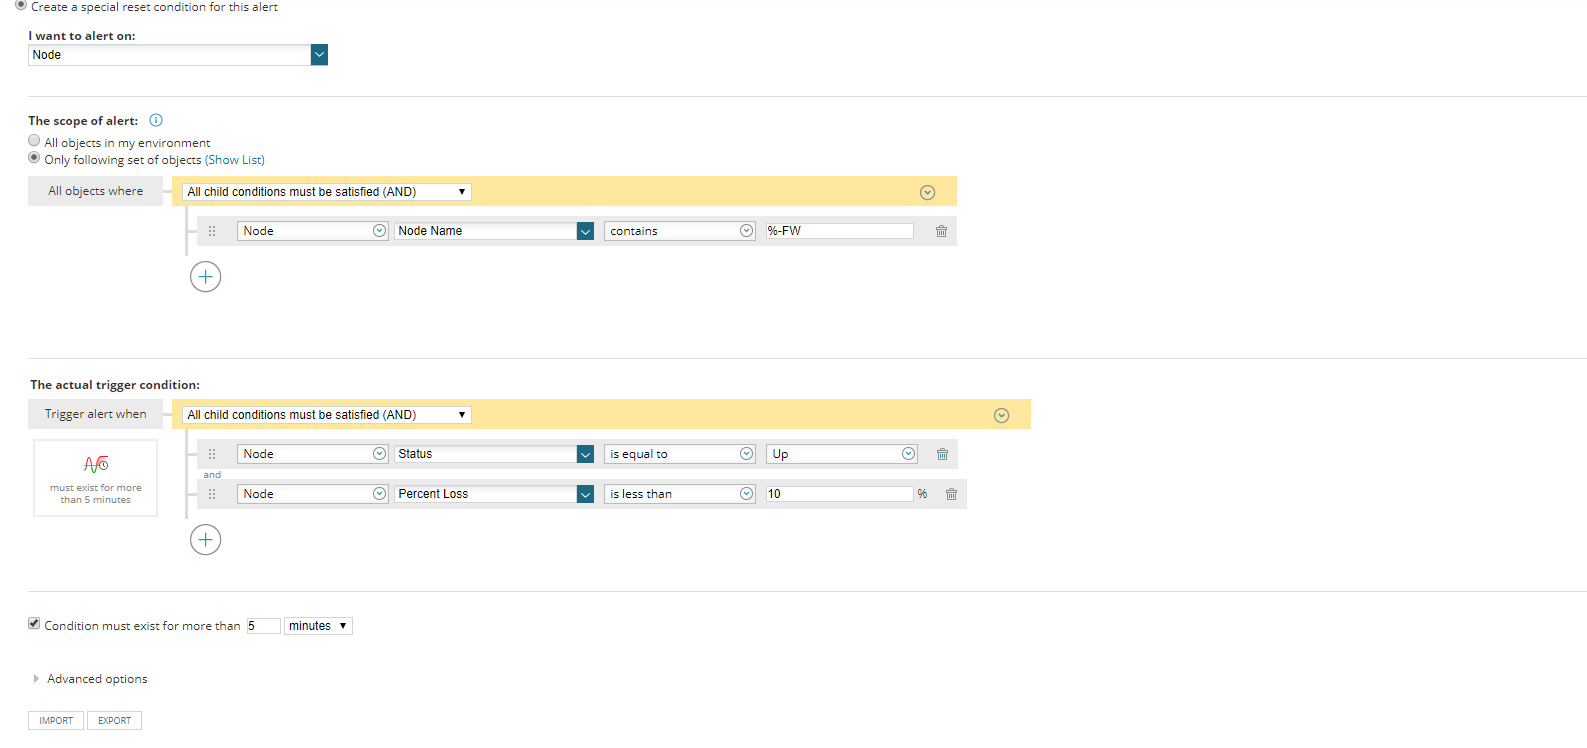
I have alerts set up for disk space of fixed disk above 90% AND also for percent memory used for greater than 90%. We have NPM 12.1, SAM 6.4 and Platform version of 2017.1