I couldn't find a way to display the recent count history for remote access sessions across our ASAs natively, and it took some time to figure out the custom chart so I'm sure others can use this information.
To start with I added a custom chart to the home page. For the datasource I selected custom SQL and used this query:
SELECT ASA_RemoteAccess_Detail.DateTime, ASA_RemoteAccess_Detail.ActiveSessions, NodesData.Caption
FROM ASA_RemoteAccess_Detail
inner join NodesData ON ASA_RemoteAccess_Detail.NodeID = NodesData.NodeID
Clicking Preview Results showed some of the connection count history.
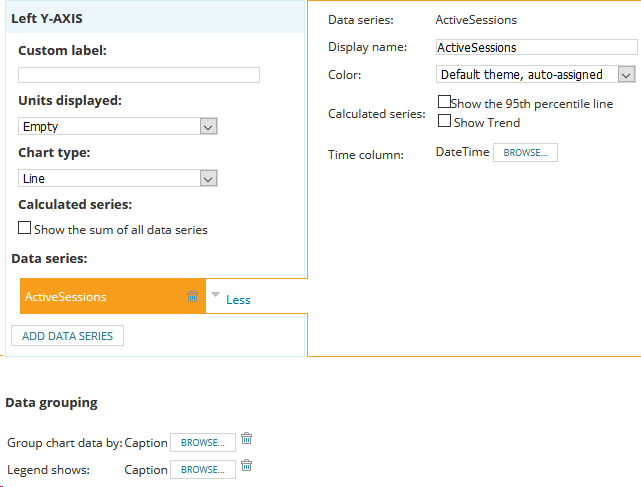
To display results in a chart I set the left axis to show ActiveSessions, DateTime as the time column, and used Caption for both the group by and legend fields.
I don't know why there isn't already a chart for this, but this has been very useful already. I hope it helps someone else.