What sorts of charts, graphs and info do you have on your NPM Summary page? Looking for suggestions outside of what I have.
Thanks!
All Nodes list
A Map with our main sites on it
Top 10 Nodes by Average Response Time
Top 10 Nodes by Average CPU Load
Active Alerts
Top 10 Interfaces by Percent Utilization
In addition to the above, I also usually have multiple "All Nodes" lists but with a different sort by grouping. E.g. depending on the custom properties in use or the customer requirement you could have the following:
State -> Site
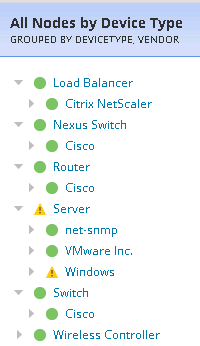
Network -> Device Type
I would add Top 10 interfaces running errors and discard very help full with your wan links as some cases you might find the wan link bandwidth is underutilized but there is still discards due qos policies
I would have the following:
All Nodes List
Hardware Health Overview
Nodes with Problems
Last XX Events
Volume Utilization in the past 7 Days
Interfaces with High Percentage Utilization
Regards,
Sam
Hi lbrowne,
NPM Summary page -
regards
Ravi
I have these:
* Top Level Service Status Map
* All Nodes
* Links to core reports
* Active Alerts
A query to show SNMP monitored devices where SNMP connectivity seems not to work. I have no idea why that is not natively available/ out of the box.
lbrowne,
I have to remind myself on a daily basis, that sometimes in the world of web design, simple is always best! Here are some favorite links I use every time I want to change my display. I ALWAYS refer back to a display from jbaulsir in the posting NOC View/Dashboard - is this available for NPM, APM, & Netflow? It's clean, and gets the job done. But I also look to others for inspiration, answers and ideas:
Re: Orion Dashboard Screenshot samples
Re: Post your Solar Winds home page
The biggest issue you will run into...the more you try to display on a single screen, the slower it takes for the screen to display...simple web design physics. There are also tons of other postings for this stuff with LOTS of other ideas, just search for "dashboard," "noc," "home page," or "summary view."
D
Care to share your build of this add on? Sounds like a good one!
This is been great input so far fellas!
What do you currently have on yours?
I totally agree with the stripped down version of the NPM "NOC View" method due to page load times.
I have a general overview of Network/Device Health, visually with MPLS and Site specific maps, all nodes - Tree, VOIP Call manager stats, Failed Calls, Hardware overall Health, Alerts and End of Support Devices.
Is a bit of information from all of the mods except SAM. I have a second monitor to pull up the SAM Summary page to not cause more delays for the NPM Summary.
I tried more on the NPM Summary page over the years, but the slow load cause me to whittle it down to just the overall facts.
BSpencer
Currently have:
- Node tree by Vendor
- Active Alerts
- List of all VLANS
- High Errors & Discards Today
- Top 25 Nodes by % Packet Loss
- Top 10 Node by Avg CPU Load
- Top 10 Int % Util
SQL query:
SELECT Nodes.Team AS Team, Nodes.NodeID AS NetObjectID, Nodes.Caption AS Name, Nodes.LastSystemUpTimePollUtc AS LastSystemUpTime FROM Nodes WHERE ((DATEDIFF(mi,
Nodes.LastSystemUpTimePollUtc, getutcdate()) > 15) AND (Nodes.Status = '1'))
ORDER BY 1 ASC
Advise, do not put any list or top xx on the Summary page as it has the tendency to list a lot of information and upon login on Orion web - this query all resources and making your initial login takes time.
These are not on my initial Orion Summary page, this is when you select Network tab - NPM Summary.
Cheers
On your last point - it depends on "Zoom" level. You can try to display 2 million elements on one screen - it will no doubt fail to load. However, if you group them together - this will take much faster to load. If you then group those groups .... yee, you may end up with just one object - not a biggie to load I guess. Just one big green blob which says - "Okay, I'm going to step off the LM now"
ABSOLUTELY! I'm a big fan of groups and nested groups. The less the page has to initially display, the faster the page load.
Does anyone know how I can group the devices in a drop down list.. So I would want be like: Core Devices, Distribution Devices, Access Devices, Servers, Storage, Firewalls.. Then within each group there would be a sub-group called vender.
Thanks in advance
David
You could create a custom property "DeviceType" or whatever you want to call it and configure it with a drop-down menu with the values Core Devices, Distribution Devices, Access Devices, Servers, Storage, Firewalls, etc.
Once the custom property has been created, assign a value to every device in the system.
On the Summary page, you can edit the All Nodes tree resource or add another one, where you can see the 1st level to be the custom property, and the 2nd level to Vendor.
You should get something like this: