Good afternoon,
In SolarWinds NPM, is possible create a dashboard with several chats of traffic, of various interfaces, of multiple nodes / sources?
Thank you.
Best regards,
NM
Yes. One way is to create a summary page and add one of the resources like Top 10 or Top 25 or Top 50 or TopXX list of whatever flavor you desire. If you choose TopXX you can specify what XX is. You can also add a filter to limit the type of interface shown.
Nunomira,
You can also add a multiple object chart to your summary page to get traffic data in a chart view. I would suggest creating a totally separate view, using left hand navigation and put a chart or two (RX/TX) on each page along with other associated data, say by site, city, etc.
Dave Burton
Loop1 Systems
Yes, you can!
It is possible create a new view with all this informations, and put in your monitoring portal.
Or if you want, you can create a new view, and put this in the Monitoring TV.
- If you work with Custom Properties, you can create a custom for this that you want, and after create a dashboard filtering the nodes and interfaces that you want see.
Regards,
Rodrigo Almeida.
Hello people,
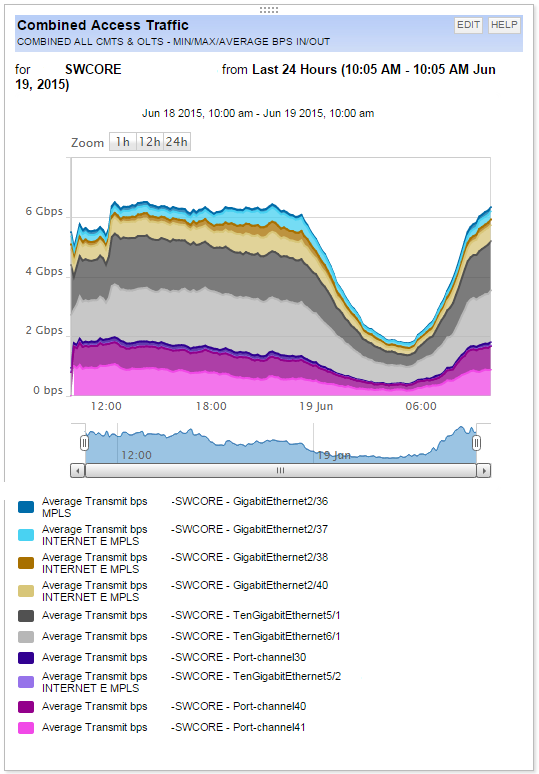
I've already create my dashboard, with custom graphics.
Thank you for your help : )
My new question is:
Is it possible to remove subtitles and date/time, to give more prominence to the chart?
Thanks
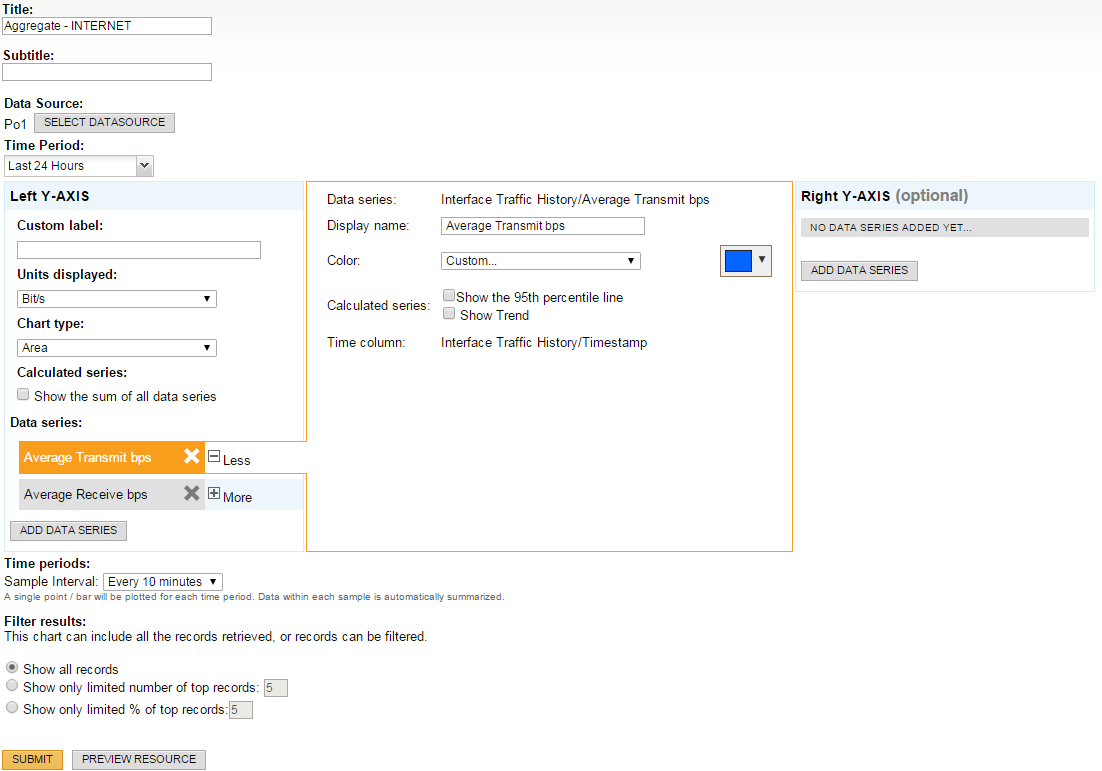
If you click Edit in upper right corner you may be able to remove the subtitle.
I searched, but did not find anything ...
Please look at the options available.
Thanks!
Something you cant remove, the npm brings to you.
But
Custom Label / Display Name / Title / Sub Title you can change.
Regards