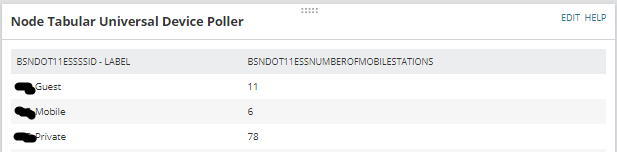
I'm trying to setup a chart to show our SSIDs and how many clients are associated with each. I have a Node Tabular UDP table working, but can't get the info into a chart. I have tried various options using a UDP summary chart and a Multiple UDP chart. Below is a sample of my table I have working, but I want to be able to see history and a graph/chart.
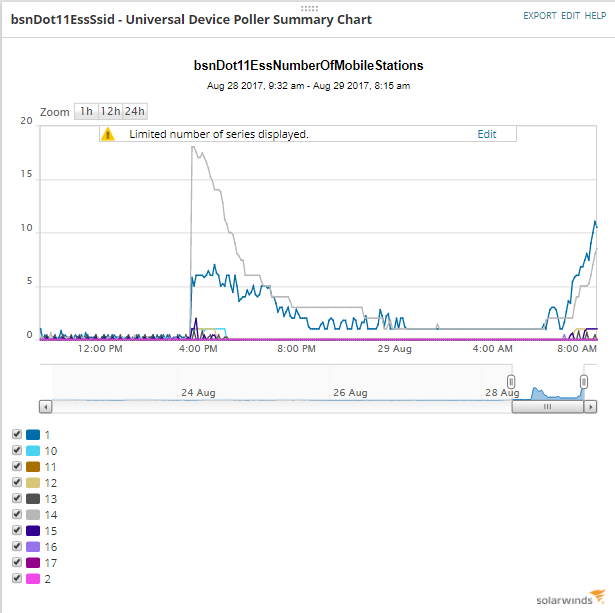
The best I can get on a chart is choosing bsndot11essssid, but then it lists the number of the SSID and not the name as a label so I don't know really which one is which. See below. I can kinda guess by looking at my table, but that is not convenient.