I think I've come across a random bug and wanted to know if anyone has come across a similar issue or know of a fix. Or if someone could test it on their system and verify? (Need a UnDP with negative values)
SHORT VERSION: There seems to be a bug with Custom Charts and UnDPs with negative values - the chart shows no data.
LONG VERSION:
On a Summary view, I'm trying to create a chart that shows me the value of a specific Universal Device Poller from multiple devices (i.e. 6 lines for 6 different device values).
I can use the Multiple Universal Device Pollers Chart and this displays the data on the legacy flat charts (can't zoom in, hover over points for values, etc).
If I use a Custom Chart, with a filter for the specific UnDP and for the nodes I want on the chart, the chart legend finds the 6 devices but the chart shows no data.
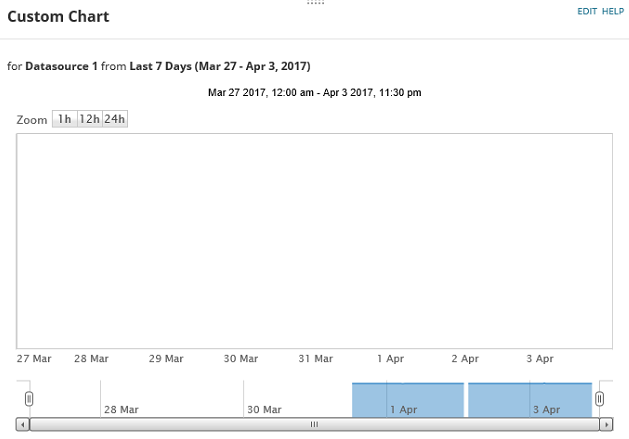
I know the datasource is correct as I can see the data is available in a Custom Table using the same datasource.
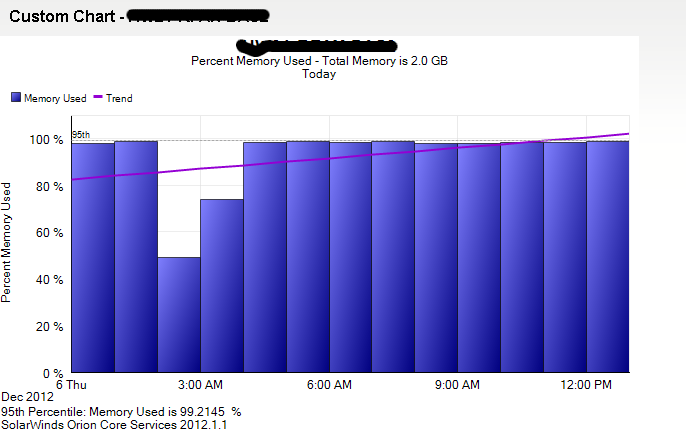
If I use the same process for a UnDP with positive values, the chart displays with no issues. This only occurs on a UnDP with negative values.
Anyone else have the same problem?