Hi All,
I've been playing around quite a bit with reporting and dashboards over the last few days and am struggling to get some of the data in the format I want.
Before I spend too much more time on it, I'd like to know if what I'm trying to achieve is even possible out of the box, or if I'd need to look at custom development to get the data in the format I would like.
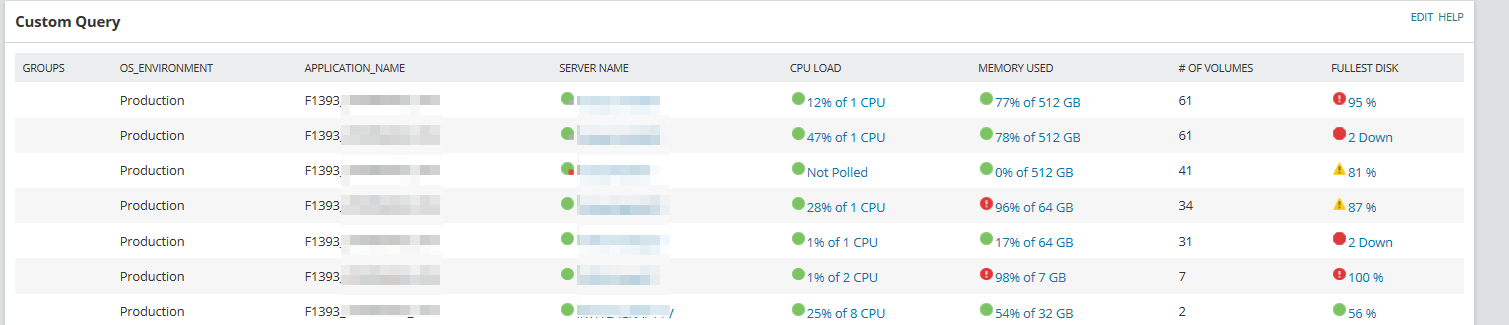
I've attached a simple mocked up example for what I can see in the GUI vs how I would like to display basic VM data. The percentage bars provide a nice visual, but I can't see a way to combine or use that source data in a new table or report.
Ideally, I would like to list my Nodes on separate lines with KPI data in the format shown, but if we set aside the possible pitfalls of that, is it even possible? How do I reference the CPU load and Memory used bars in a report, because I just can't see how I do it.
If I create a new view and add the resource "Top XX Volumes by Disk Space Used", I have data there that I want to use in another report, but I can't see how I add a percentage bar into a new report or even edit the layout of that report. It is even possible?
Many thanks in advance,
M