I recently added a pair of vCenter 6.0 Server Appliances to my NPM 11.5.3 instance. However, the status is still unknown even hours later. Cred tests pass just fine. Is this a known issue with VCSA 6.0?
I have an open ticket with vmware regarding the CPU and memory problem that you're seeing. It's been open since FEBRUARY. We are still doing stupid basic troubleshooting and this guy is sending every response out for "consultation." It's despicable service. Rant over.
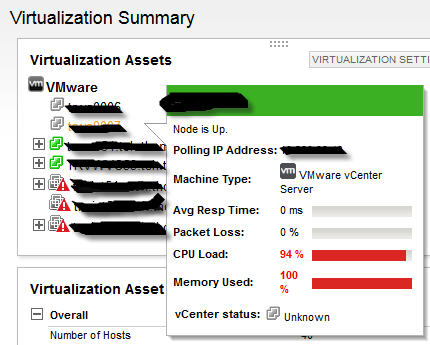
Anyway, I have vcenter status as Up in my scenario, but average CPU and memory are pegged at 100% according to NPM. It's definitely not the case when viewing in vcenter. I have verified vcenter MOB URL is reporting correct information. One thing that might be gumming up the works is that vsphere 6 disabled MOB by default on esxi hosts to increase security. If they're reading data directly from hosts rather than from vcenter then perhaps that's an issue. I did try enabling it for a bit on the host that my vCSA sat on but that didn't help so perhaps it's a red herring.
What I do know is that something is definitely wrong with polling vcenter appliances in NPM and I can't raise someone with enough knowledge at solarwinds who can do something about it.
So I'm replying to myself to say I got a resolution (if not good news) on this case. It turns out vmware is returning nonsensical information for the OIDs they say are correct for monitoring CPU and Memory. Solarwinds is reporting what is being sent to it via SNMP but that's wrong. I'm opening a case with vmware now to see what if anything they're willing to do.
Any update on correct OIDs for reporting Multi-CPU and Memory from VMware?
Yeah - vmware fixed this I believe in 6.0U2, but definitely it's fixed in 6.5