Hello,
We have infobloxs in our monitoring, but how to monitor the infoblox services like DNS, DHCP & IPAM in solarwinds?
how the services configurations can be done?
We're using a custom Universal Device Poller (UnDP) to get DHCP subnet utilization for Infoblox.
Here's the XML for the poller. Copy and paste into a new file, then import into Solarwinds using the Universal Device Poller application.
<?xml version="1.0" encoding="utf-8"?>
<CustomPollers version="9.0">
<CustomPoller UniqueName="ibDHCPSubnetNetworkAddress" Description="DHCP Subnet in IpAddress format. A subnetwork may have many 
 ranges for lease." OID="1.3.6.1.4.1.7779.3.1.1.4.1.1.1.1" MIB="IB-DHCPONE-MIB:ibDHCPSubnetNetworkAddress" SNMPGetType="GetSubTree" NetObjectPrefix="N" GroupName="Infoblox" PollerType="S" Parser="None" IncludeHistory="True" Unit="" TimeUnitId="0" TimeUnitQuantity="0" DefaultDisplayTimeUnitId="0" Formula="" LabelType="SameTable" LabelDetail="1.3.6.1.4.1.7779.3.1.1.4.1.1.1.1">
<Enumerations />
</CustomPoller>
<CustomPoller UniqueName="ibDHCPSubnetNetworkMask" Description="DHCP Subnet mask in IpAddress format." OID="1.3.6.1.4.1.7779.3.1.1.4.1.1.1.2" MIB="IB-DHCPONE-MIB:ibDHCPSubnetNetworkMask" SNMPGetType="GetSubTree" NetObjectPrefix="N" GroupName="Infoblox" PollerType="S" Parser="None" IncludeHistory="True" Unit="" TimeUnitId="0" TimeUnitQuantity="0" DefaultDisplayTimeUnitId="0" Formula="" LabelType="SameTable" LabelDetail="1.3.6.1.4.1.7779.3.1.1.4.1.1.1.1">
<CustomPoller UniqueName="ibDHCPSubnetPercentUsed" Description="Percentage of dynamic DHCP address for subnet leased out at this 
 time. Fixed addresses are always counted as leased for this 
 calcuation if the fixed addresses are within ranges of leases." OID="1.3.6.1.4.1.7779.3.1.1.4.1.1.1.3" MIB="IB-DHCPONE-MIB:ibDHCPSubnetPercentUsed" SNMPGetType="GetSubTree" NetObjectPrefix="N" GroupName="Infoblox" PollerType="S" Parser="None" IncludeHistory="True" Unit="" TimeUnitId="0" TimeUnitQuantity="0" DefaultDisplayTimeUnitId="0" Formula="" LabelType="SameTable" LabelDetail="1.3.6.1.4.1.7779.3.1.1.4.1.1.1.1">
<CustomPoller UniqueName="ibDhcpTotalNoOfRequests" Description="This variable indicates the number of 
 requests received" OID="1.3.6.1.4.1.7779.3.1.1.4.1.3.2" MIB="IB-DHCPONE-MIB:ibDhcpTotalNoOfRequests" SNMPGetType="GetNext" NetObjectPrefix="N" GroupName="Infoblox" PollerType="C" Parser="Counter" IncludeHistory="True" Unit="" TimeUnitId="0" TimeUnitQuantity="0" DefaultDisplayTimeUnitId="0" Formula="" LabelType="" LabelDetail="">
<CustomPoller UniqueName="ibServiceDesc" Description="Service Description." OID="1.3.6.1.4.1.7779.3.1.1.2.1.9.1.3" MIB="IB-PLATFORMONE-MIB:ibServiceDesc" SNMPGetType="GetSubTree" NetObjectPrefix="N" GroupName="Infoblox" PollerType="S" Parser="None" IncludeHistory="True" Unit="" TimeUnitId="2" TimeUnitQuantity="0" DefaultDisplayTimeUnitId="0" Formula="" LabelType="" LabelDetail="">
<CustomPoller UniqueName="ibServiceStatus" Description="Service Status." OID="1.3.6.1.4.1.7779.3.1.1.2.1.9.1.2" MIB="IB-PLATFORMONE-MIB:ibServiceStatus" SNMPGetType="GetSubTree" NetObjectPrefix="N" GroupName="Infoblox" PollerType="S" Parser="None" IncludeHistory="True" Unit="" TimeUnitId="0" TimeUnitQuantity="0" DefaultDisplayTimeUnitId="0" Formula="" LabelType="SameTable" LabelDetail="1.3.6.1.4.1.7779.3.1.1.2.1.9.1.3">
</CustomPollers>
Once you've added the pollers, you can add them to the Solarwinds page for your Infoblox devices.
I was able to import this Custom UnDP, and I was able to assign them to my infoblox devices. However, I'm not certain how to view the polling details from the custom pollers? I've tried adding some customer UnUP charts, but not seeing any details about DHCP or DNS entries. Any help in viewing, or setting up a custom chart to view DHCP and DS details would be very much appreciated.
Thanks!
Hi cszell@gatehousemedia.com,
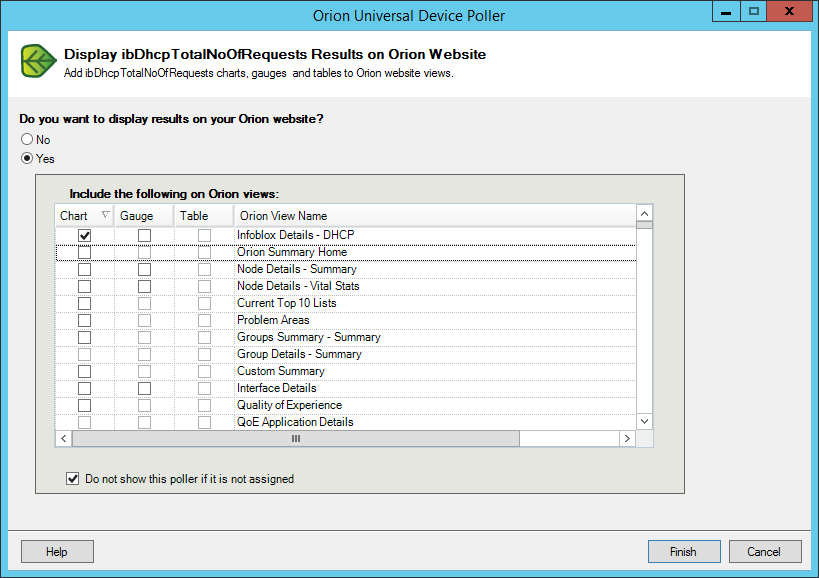
Just because this isn't complicated enough, you also have to tell the UnDP what kinds of views can display the data for a poller. Right-click on the poller definition (under "ALL DEFINED POLLERS") and choose "Web Display" from the pop-up menu. This will bring up a list of views. In that list, you can choose the views that can show the poller data as well as how to display the data (table, gauge, chart). Here's what it looks like in my installation:
After you do this, you'll be able to see the poller data on that page (for devices that have the poller assigned).
I've got my Infoblox UnDP poller built, but I am not seeing the Infoblox details in the poller, what am I doing wrong?
OK! That got it! Man, that was sure harder than it needed to be. Thanks so much!
Glad it's working now!
Solarwinds, if you're listening, please make this process easier!
Thanks for the info.
Now, how do i display the stats top 10 only with ascending order of DHCP percentage used?