I've started to notice that some of our alerts periodically fail to translate variables in some cases. This is usually caused by a misconfigured alert, but recently I noticed it happening on long-standing alerts that generally work. In this specific case, it is a random occurrence. In the past few days we generated 142 alerts for this particular configuration and 4 of the 142 failed to translate the variables. While not a huge number, it does mean that 2.8% of those particular alerts didn't work. That's a high failure rate in a business where the only thing that matters is people trusting their alerting!
So I went digging. For context, we run a single instance SolarWinds environment with 17 additional polling engines across 3 data centers with almost 98K elements and 22K application monitors. We have VMAN integrated and have deployed SRM alongside a lightly used NTA. Now I know that the alerting service is SolarWinds.Alerting.Service.exe and Process Explorer says that is is using about 3% of my total CPU on my 8 vCPU. I also know that my processor queue length runs at about 5 for this server and that most of my CPUs are about 60% utilized at any given time.
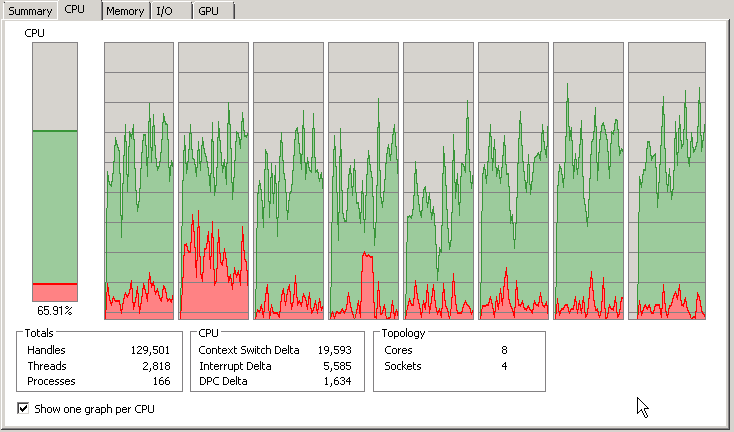
Except for processor 2 (or in SolarWinds, processor 3!).
From the screenshot below you can see that SolarWinds.InformationService.ServiceV3.exe is railing this processor. All the time. (See screenshots below)
The SWISv3 exe is 2015.1.1.6134. No, I am not running NPM v12 yet.
Is anyone else seeing similar behaviour on this executable? Anyone else noticing problems with interpreting variables where this service is railing a processor? This SWISv3 service consumes far and away the most amount of CPU time of any service on our primary poller. At the time of this posting, SWISv3 had consumed 65 hours of CPU time. The next closest was our Splunk agent (31 hours) and the next closest SolarWinds process was a BusinessLayerHost that was 4.5 hours.