Is it possible to create a graph for availability reports for a group of Nodes or application. The maximum Sample interval in Custome resourse is 7 days, which is splitting it as weekly reports. I am looking for a single graph for one month.
Tom
Hi Tom,
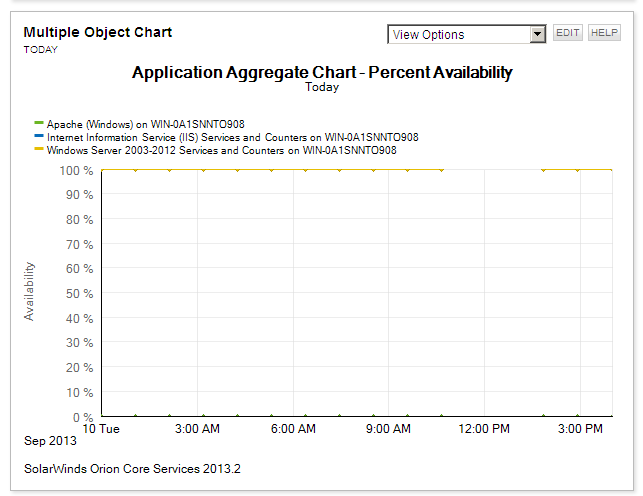
have you tried to use 'Multiple Object Chart' resource? There should be possible to display availability of multiple applications in longer period ...
Petr S.
Hi Petr,
this option is not available in Multiple object Chart. Also Multiple object Chart have only limited types of graph, ie it does not have a bar diagram.
Off hand I can't think of any chart, other than the Multiple Object Chart Petr referenced above that is capable of representing availability for multiple applications. You may however have success creating something similar to what you're looking for using the Custom Charts in the new web based Report Writer included in SAM 6.0.
Hello,
I want a availability report on one year with 12 columns who represents each month (for one node or group of nodes)
In web based Report Writer, I have the same problem than tomjose, the max sample intervalle is "7 days". It would be better to have an interval of one month but support told me that it was not possible.
anyone have a tip?
It would be a pity we can not do something as simple...