Hello,
I am currently in an evaluation period for NTA. I currently use Riverbed's NetProfiler for our netflow analysis and one of its primary functions for us is to graph real time bandwidth usage per site. I am sure NTA is capable of such a feature, I just dont know how to set it up. Everything seems to combine all intefaces/traffic that I have monitored, but I want to make separate widgets so Site A with 100Mbps in/out is currently using x amount in/out, Site B with 50Mbps is using X and so on. I then want to put them all onto a single dashboard in NOC mode so that we can see site usage in real time.
Any help for a newbie would be appreciated!
Edit:
So, After playing around a bit more, I think I know what I want, I am just not sure how to make it happen.
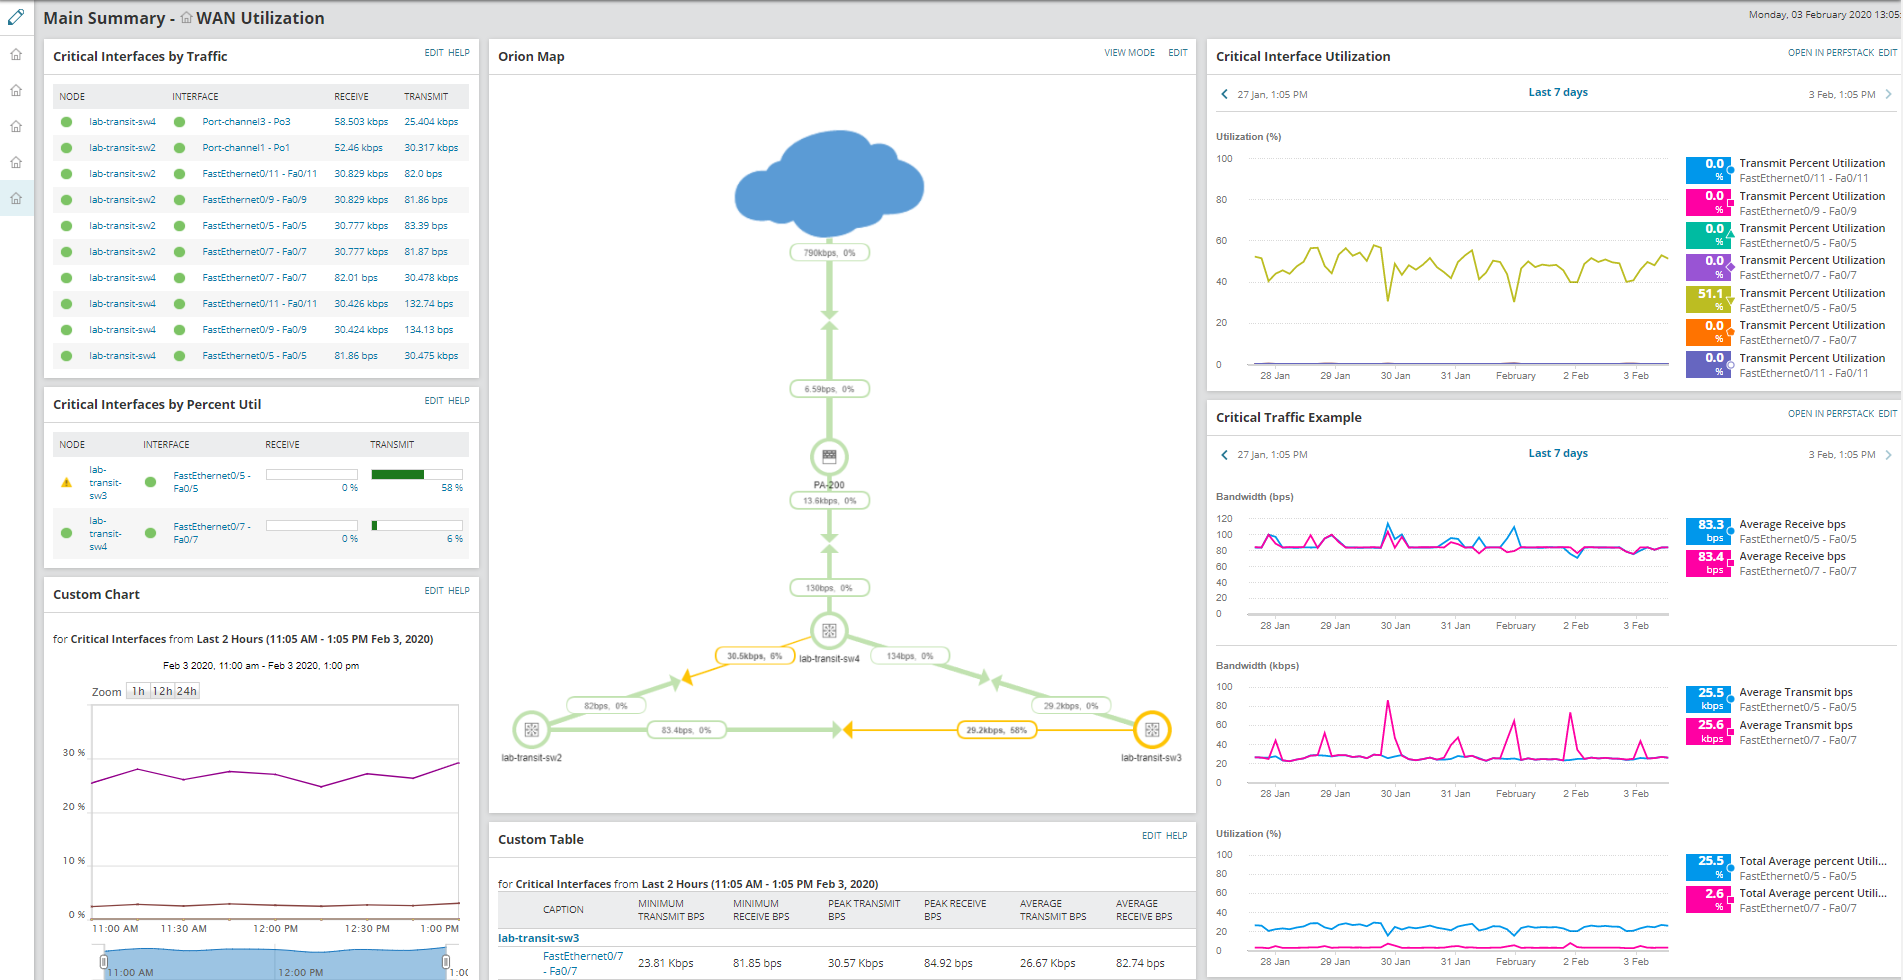
When looking at a specific interface for a router, I can set the WAN bandwidth and get the "Percent Utilization" graph. I would like to make a view that has that graph for each outside interface for each boarder router. So now, I have a dashboard showing me real time bandwidth usage. Then, if I click on an interface graph, I can go to the actual netflow data to get top talkers for that interface to see who is using it all up. Is something like that possible?