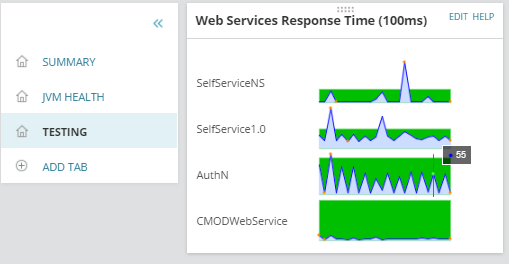
I wanted to share something I thought would be beneficial to some of you. I came across a way to create sparkline charts using jQuery and was able to cobble something together to leverage Orion data. I've written a how-toCustom Sparkline Charts. It's pretty straight-forward. I know it can be tweaked to be more dynamic, but this is my first shot at it. Here is a sample using response time data from a few HTTP monitors.