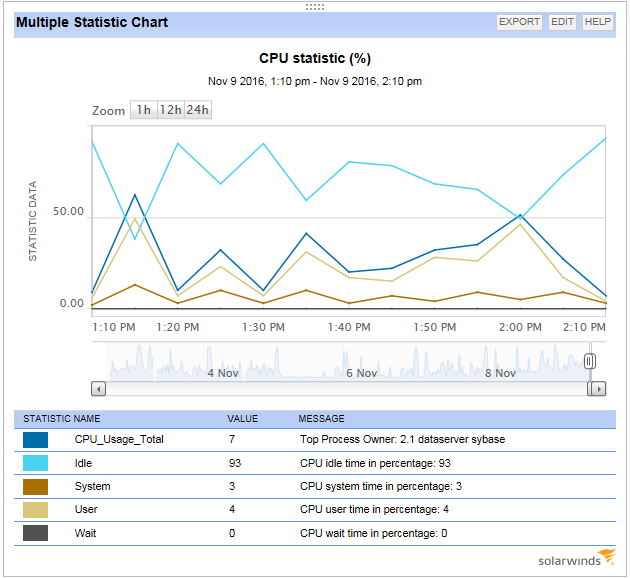
Doing AIX monitoring using AIX script to pull CPU info. The script is capturing 5 CPU performance elements, which I can see on node DETAILS page, using 'Multiple Statistics Chart', in attached chart shown below.
What's not working, is when I try to present the same multivalues elements using the same component monitor on a SUMMARY page I created in order to 'bring up' details to Summary for convenience and not requiring drill down, and there is no 'Multiple Statistic Charts' resource, and closest is a 'Component Aggregate Chart - Statistic Data', and only produces a chart of the first script element, and ignores the rest.
Is there a way I can present the multivalue stats from a summary page? Directors want a simple landing page that has details they can view without having to drill down, from summary to detail.