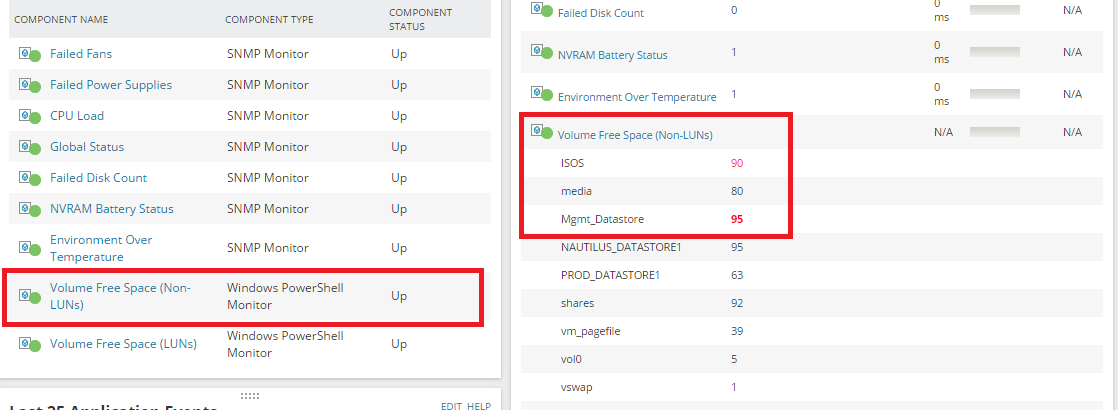
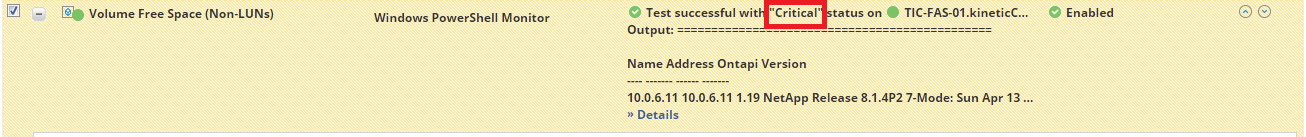
I have a the following Powershell script that collects the volume size of all volumes on on NetApp array. This will return the size for each volume where there volume name does not end with "_lun". For each volume I set a warning and critical threshold and set the "Status Roll-up" to "Show worst status". One of the volumes being polled has a warning of 90% and critical of 95%. Currently that volume is at 95%. When I test the component monitor for this it returns with a "Critical" status. However, when looking at the Application Details page for the Application as whole, the status is "Green". Can anyone explain or tell me what I have set incorrectly?!?!
Script
Import-module 'C:\Program Files (x86)\NetApp\NetApp PowerShell Toolkit\Modules\DataONTAP'Connect-NaController '${ip}' -Credential '${CREDENTIAL}' $VolArray = get-navol | where {($_.name -notlike "*_lun")} foreach ($vol in $VolArray){$name = $vol.Name$percent = $vol.Used# This is important - Solarwinds requires a "Unique identifier" for# each value returned by a script. The line below creates an# identifier for each result returned.Write-Host "Statistic.$name :" $percent}Script Output Config for Volume
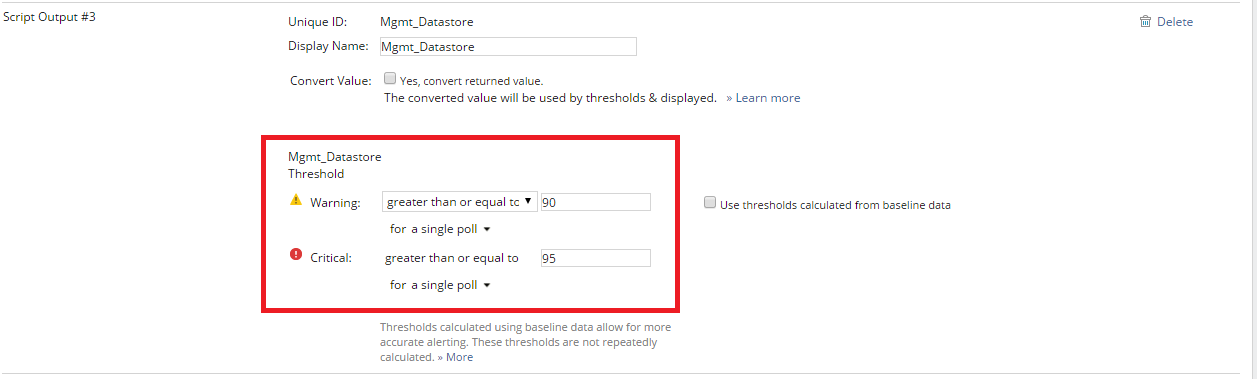
Test Shows Critical
Application Monitor Page Shows Green when should be Red