Hi,
I was really hoping for 10.4 to solve one of my main caveats with Solarwinds: UnDP graphing. This did not happened, and several feature requests regarding this have been ignored back to 10.X
So I hope the community can help me!
Several interesting mibs for Check Point, Cisco and Juniper returns a table. This could be a table of current utilization of a Cisco ACE server farm, or the connection usage of a Check Point VSX firewall.
Let me illustrate with two graphs displaying the same info: connection usage per Virtual System on a Check Point.
| Classic Style | New Style |
|---|
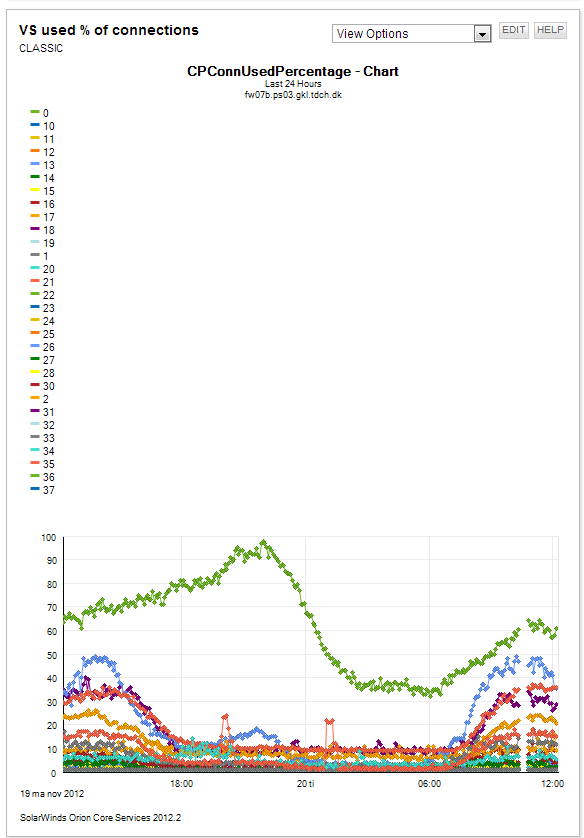 | 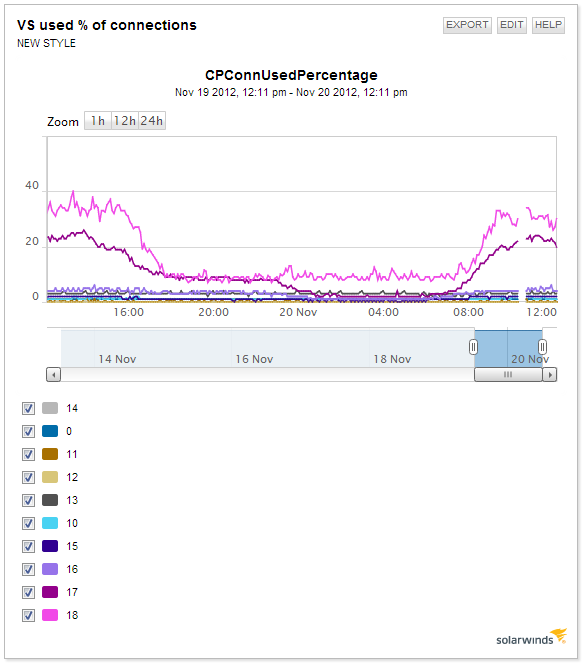 |
The two graphs shows the same data. Both graphs have the same limitation. The number of rows graphed are fixed. The New Style is even worse - limiting the display to 10 values.
I cannot even do a 'top 10' to get the most 'interesting' ones.
Can anyone guide me where I can find these fixed vaules? If Solarwinds cannot provide the possibility, I hope to hack the html / database query.
Best regards,
Henrik Noerr


