Hi all, looking to create a widget that lists all warning/critical components within templates. Specifically those within AppInsight Templates but not limited to.
Any easy way to do this without scripting?
Thanks
I would definitely do this as a report, I've done something pretty close in the past:
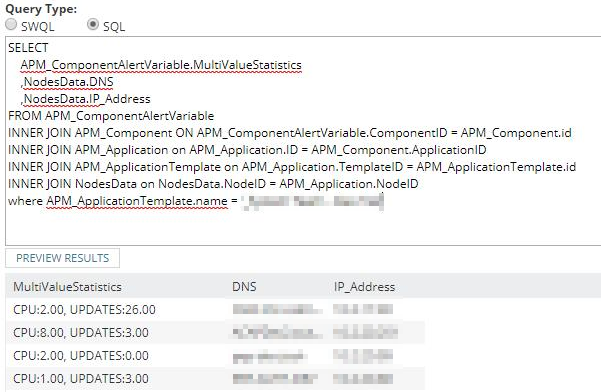
I used a Custom Table resource and the below SQL code:
SELECT
c.Application.Node.Caption as [Node],
c.Application.Node.DetailsUrl as [_LinkFor_Node],
c.Application.Node.Status as [_StatusFor_Node],
c.Application.Node.ChildStatus as [_ChildStatus],
c.Application.Name as [Application],
c.Application.DetailsUrl as [_LinkFor_Application],
c.Application.Status as [_StatusFor_Application],
ComponentName as [Component],
DetailsUrl as [_LinkFor_Component],
c.CurrentStatistics.ComponentResponseTime as [Response Time],
Status as [_StatusFor_Component],
c.CurrentStatistics.ComponentStatisticData as [Data],
c.CurrentStatistics.ErrorMessage as [Message]
FROM Orion.APM.Component c
WHERE c.Application.Node.Caption = '<specific node>'
and Disabled = False
and c.StatusDescription != 'Up'
I'm including the query as is, but you don't have to limit it to the specific node if there aren't a lot of applications on the node, additionally you can add or change the status description portion as this will show unmanaged applications as is.
From here, there's some configuration you'll want to do to the Custom Table resource to let through all of the pretty and the links:
My columns are in this order:
Node, Application, Component, Response Time, Data, Message
Node, Application and Component columns need "Add display settings" for Details Page Link (check enable tooltips) and Status Icon (Watermark).
Data and Message need the box checked for Allow HTML Tags.
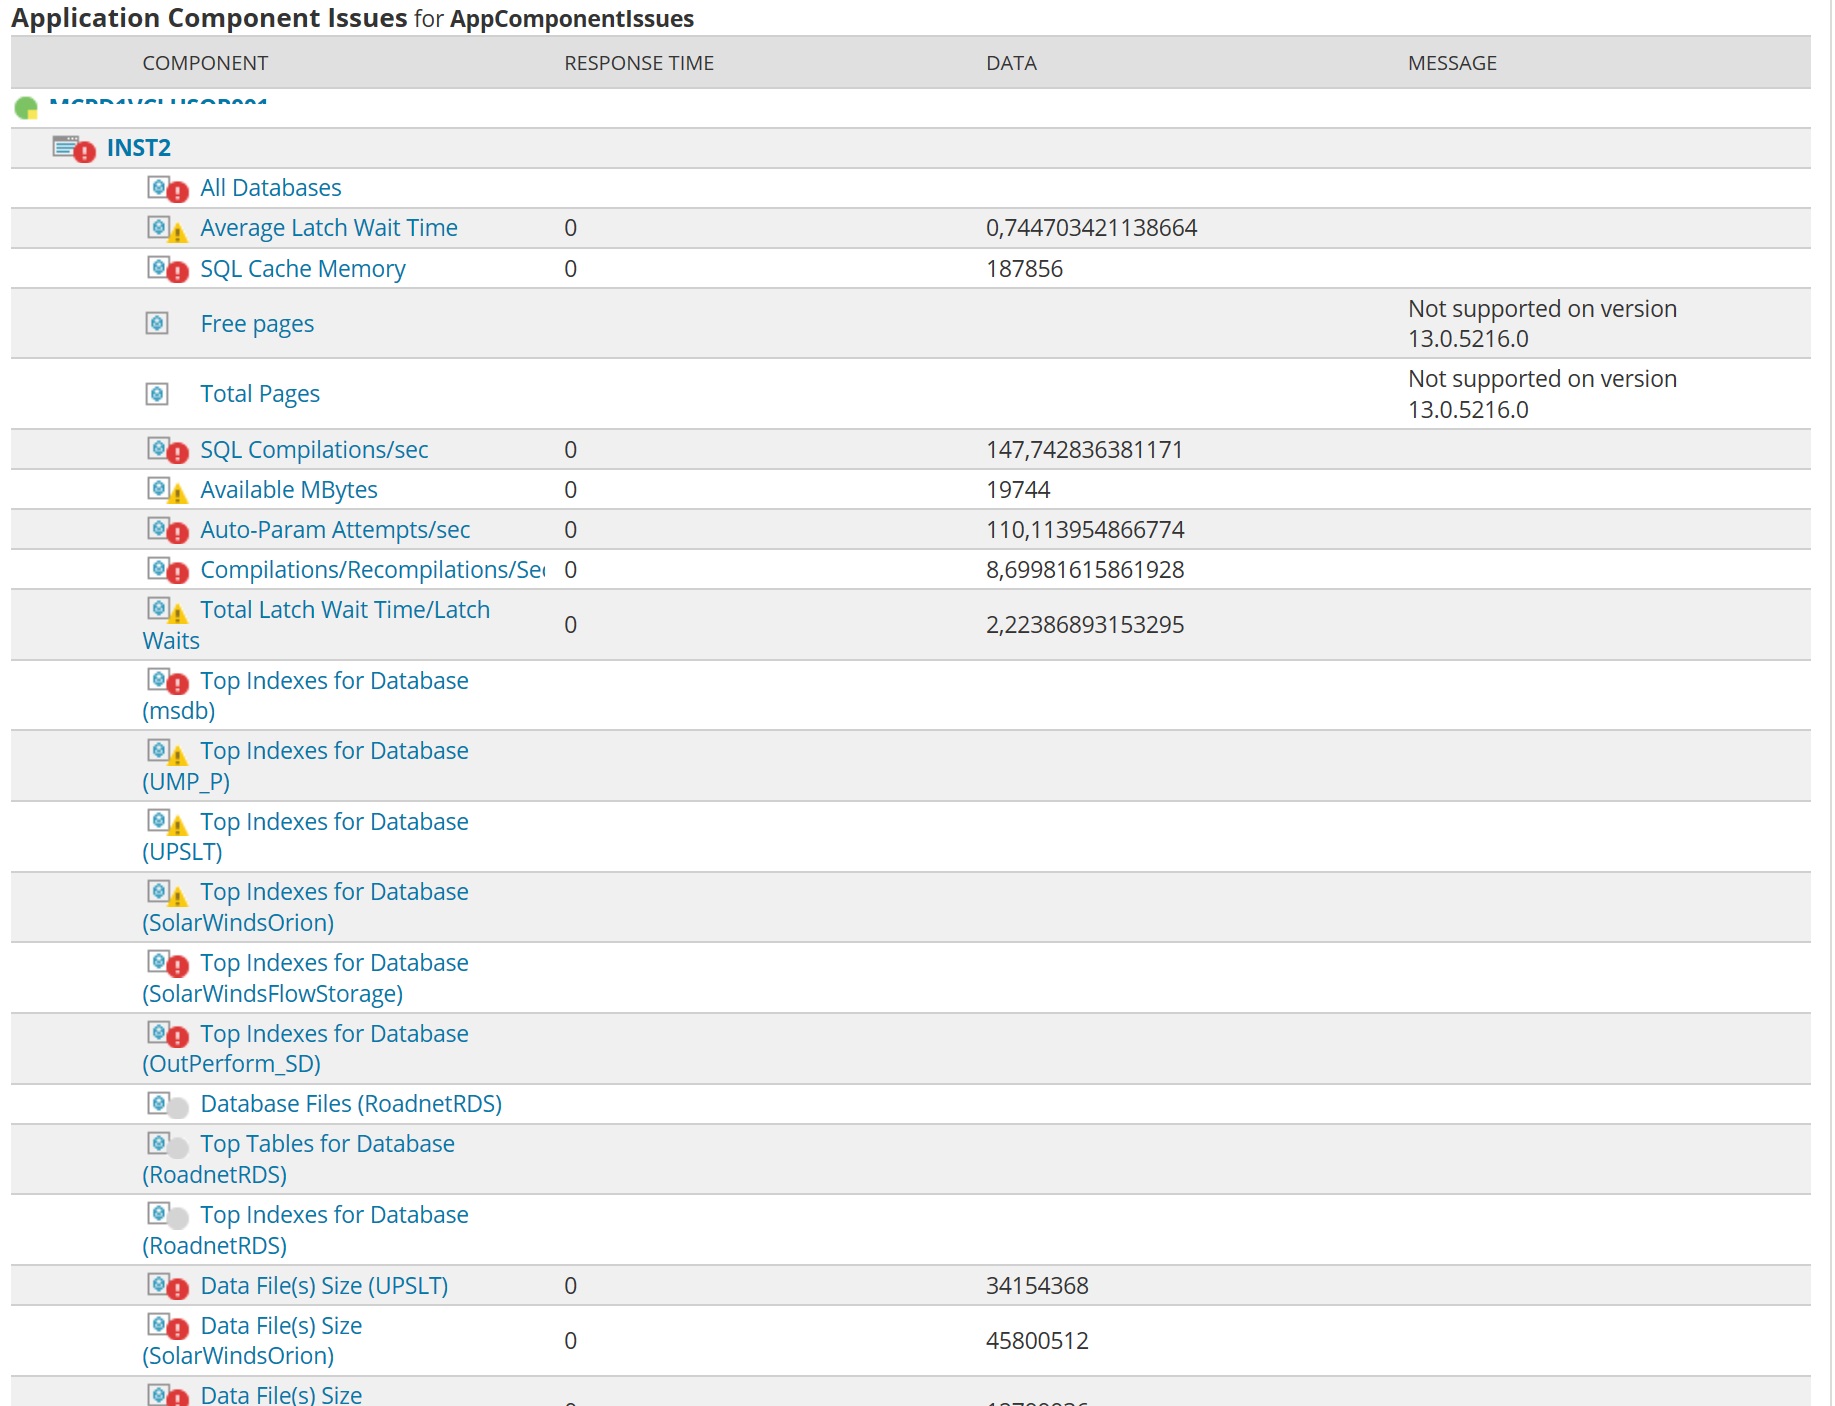
Additionally I group the results by Node then Application, here are some screenshots to hopefully help:
Thanks jrouviere
Haven't had a chance to implement, will hopefully test shortly.
Report works great. Is it possible to list all nodes as opposed to specifying a node?
Also it shows disabled/unplugged components, anyway to hide that and only show warning/critical.
Just need to update the Where part of the clause to:
WHERE Disabled = False
and c.StatusDescription in ('Warning','Critical')
The reason it limits per node is that there can be quite a few components and everything depending on what you're monitoring, my case was to put it on a dashboard which has an upper limit to what it will display anyway, so you may not be able to see everything or the output may be very long without the filtering.
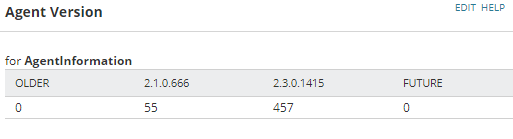
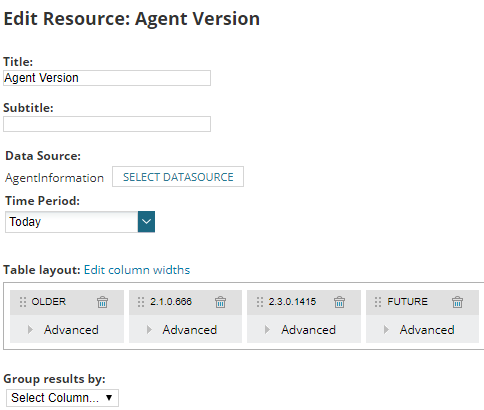
Selecting Add Widget to a view and then selecting a Custom Table will allow you to add a report as a widget. Great if it does not display to much data and consume the complete UI. I was able to make a Agent Version widget to monitor the deployment of the new Solarwinds Agent after the upgrade. This avoids the need to open a report each time. If the report does get to large break it up sos that you have two reports displaying the results from two different monitors. Or place it on a different tab.
Worked great!