Want to know what kind of aggregate impact specific stored procs have on your end users? Now you can know.
Steps:
- Bring up DPA in your browser.
- Click on "Reports" in the upper right of the interface.
- Select the instance you are interested in within the Database Instance dropdown.
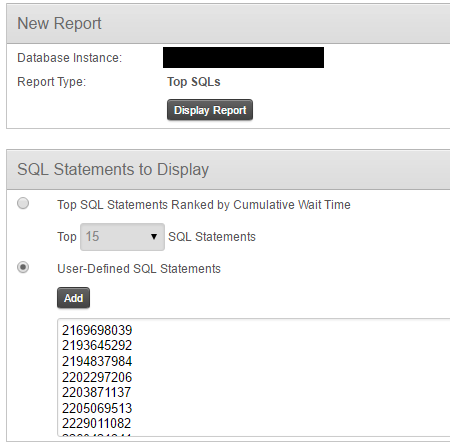
- Select "Top SQLs" within the Report Type dropdown.
- Select Report Options button.
- Under the Programs to Display section, select the "User-Defined Programs" radio button.
- Click the add button. A search popup wizard will display.
- Enter "<SPROC NAME>" in the search string area and click the search button.
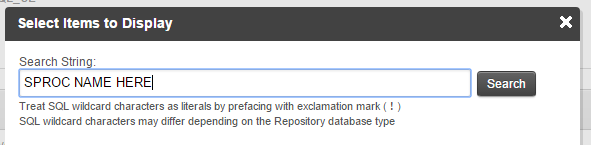
- It will likely take you to a page in the wizard where you will have to choose the SQL Text radio button, then click search again.
- Highlight all of the SQL statements and click OK.
- Click OK again.
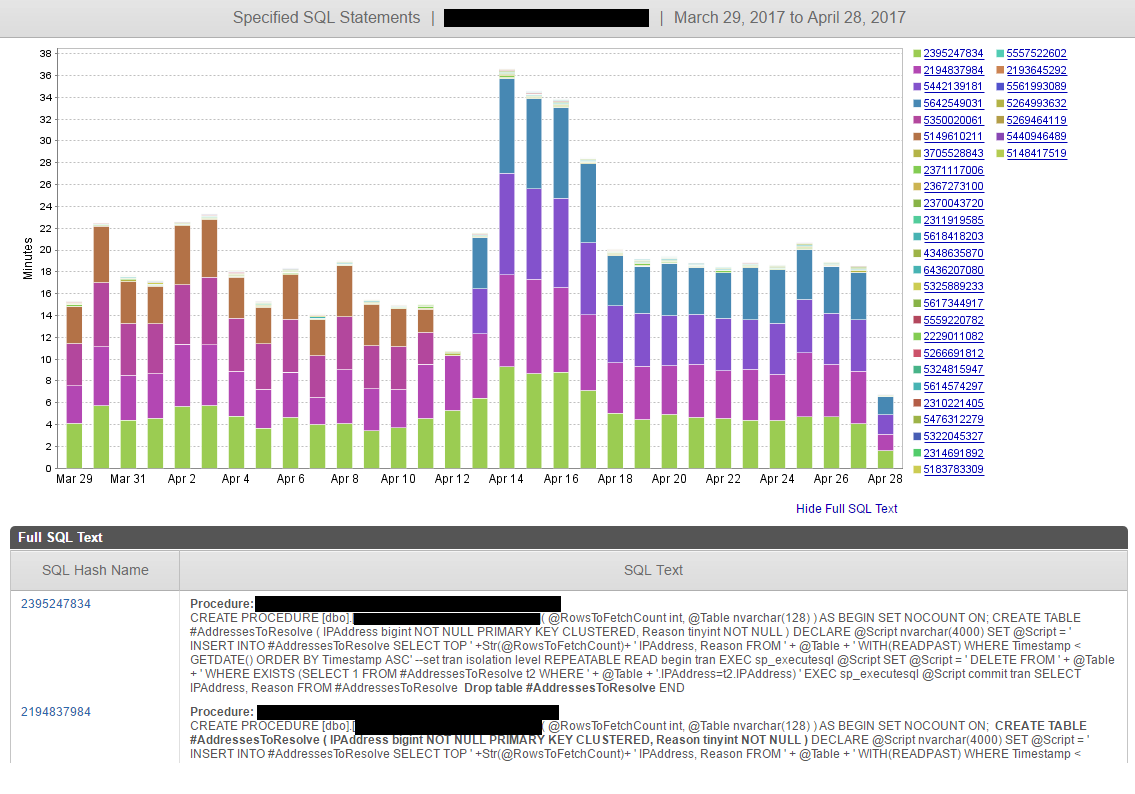
- Click Display Report on the main dialogue view.
- And the results - you can even display the SQL text below the wait time impact graph.