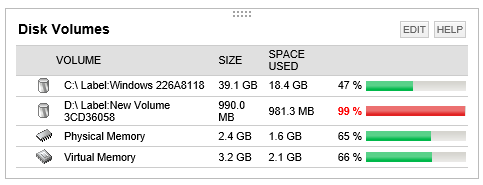
I have a server disk volume which the volume percent used is up at 97%. When I look at the console home page where the nodes are listed, the server indicator is green. Not until I drill down to the view [Node Details > Vital Stats] would I see there is an issue. And the volumes listed under AppStack is also green so it doesn't show any issue. However if I mouse-over the volume in AppStack, the drive space used bar is red.
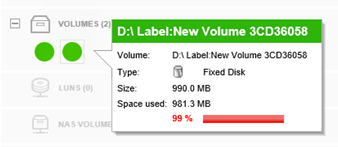
The problem is server admins would not see the issue from the console and they would have to rely on the first alert notification to discover the situation. One would think the server is completely fine. Not until one drill down to each node would see an issue.
There are couple things I like to see:
1. Can I rollup the drive health state (warning or critical) to the node so it's health indicator would reflect the drive state?
2. Is there a way I can create a similar view to the top page so our server admin has a view of all the server drives in warning or critical.
Thanks
j