One of my users just found a good one.
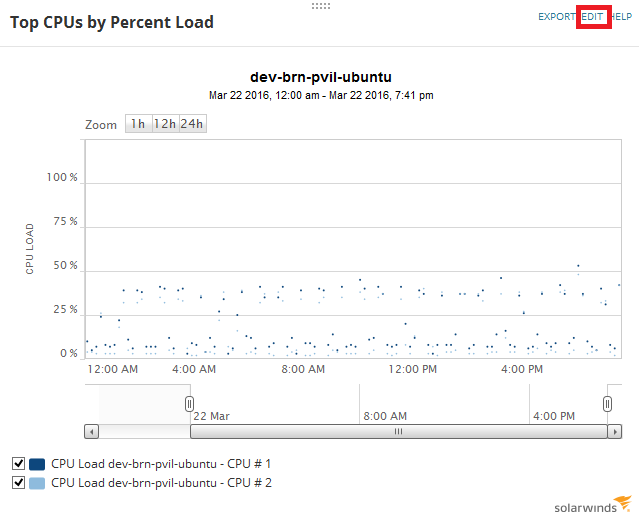
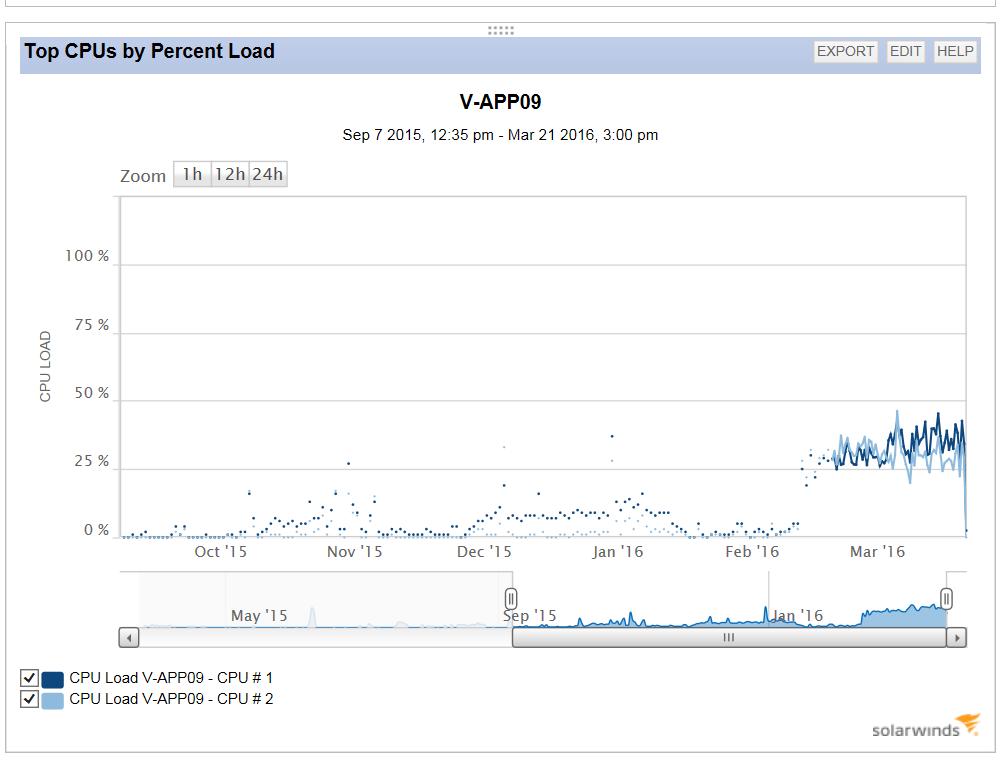
When we expand the range in the CPU graph window past a certain point, the lines turn to dots:
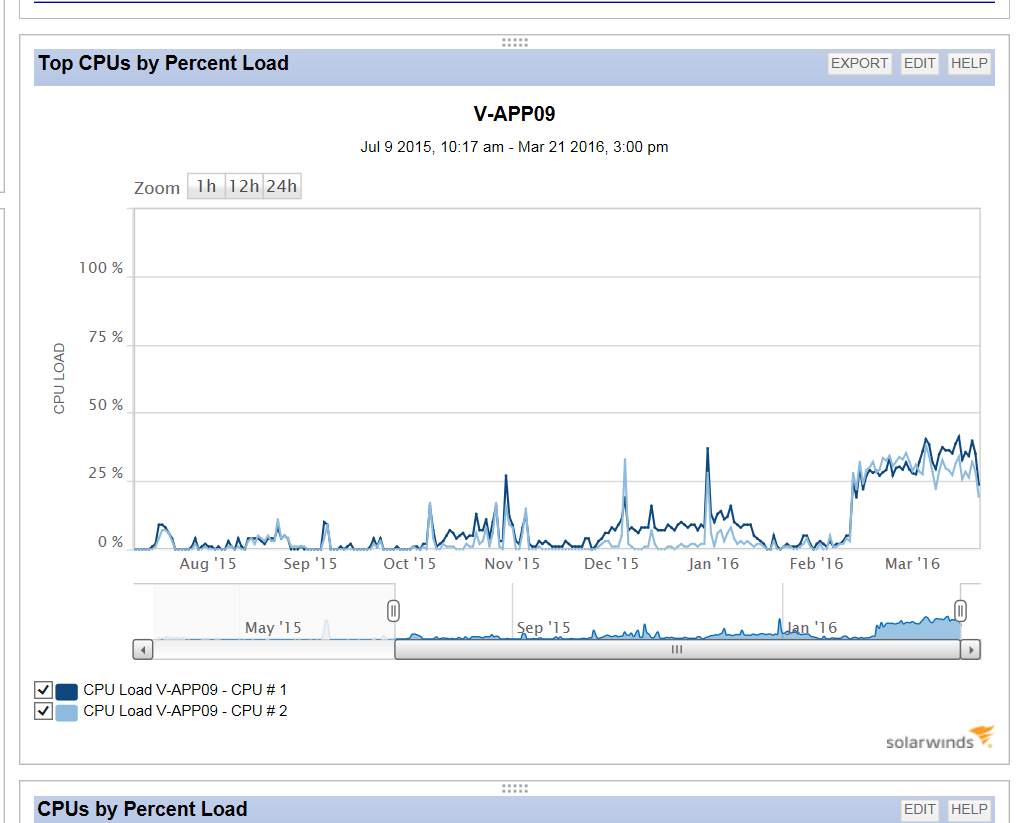
Then, when we expand the range by a few more months, the lines reappear:
I confirmed this across all three browsers.
What is going on?