Hello
I have a problem about slowness on NPM graphs.
I am using "Mix/Max/Avarage bps" graphs for interfaces on NPM. I am using chrome or explorer for solarwinds.
When I want to show 1 day data, it waits 1 munute at least. But sometimes it takes just a few seconds. I think when it want to create a png for graph it takes lots of time.
I investigate on browser about the delay for the graph and chart png takes 1.2 min !
Is it about my custom chart type? And what wolud you suggest for min max avarage bps graphs most effective using solarwinds?
Browser network console png result:
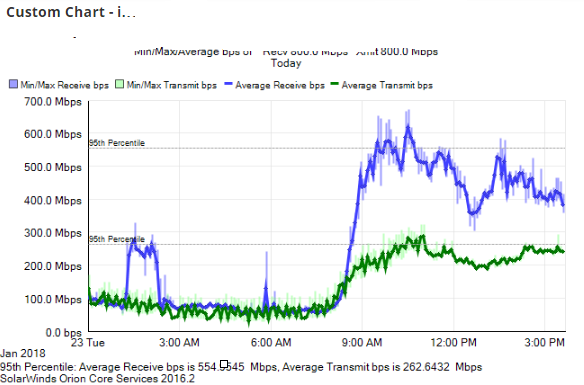
Here my graph:
Thanks