Hi Folks
Is it possible to display the result of a Transform on a map?
I have created a graphic which represents the layout of our DC and am trying to add the current power readings from APC rPDU's. I currently display this information in a table on a NOC screen but thought a graphic would look good and possibly easier to identify current status of a rack as the table displays a large list which is growing as we upgrade devices.
The table looks like this:
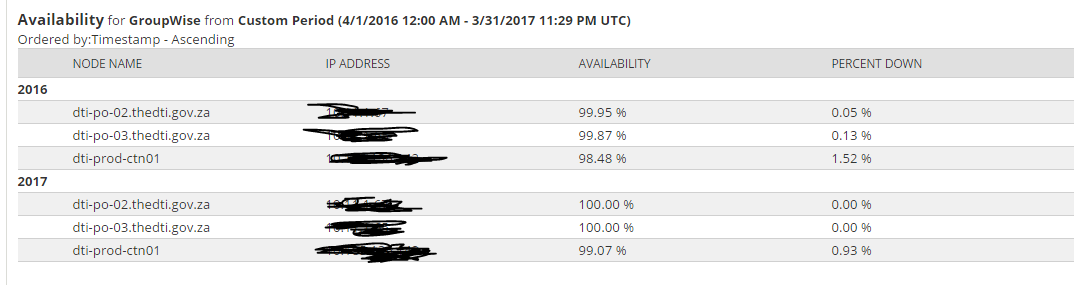
The transform is a basic % calculation which calculates kW from 10ths of Amps.
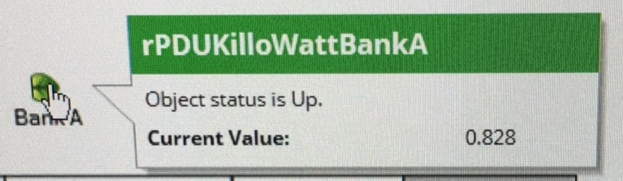
However when I place the transform onto a map I only get the status of the transform - i.e. Up / Down -
If I hover of the icon I get more details.... and it's the Current Value details that I'd like displayed on the map.
Any thoughts?
Steve