I'm a bit new to adding custom monitors in SAM, so please forgive my ignorance - I'm learning!
Anyways, my user wants me to capture how many threads a service is using over time. Is this possible and if so, how do I do it in SAM 6.1?
Many thanks.
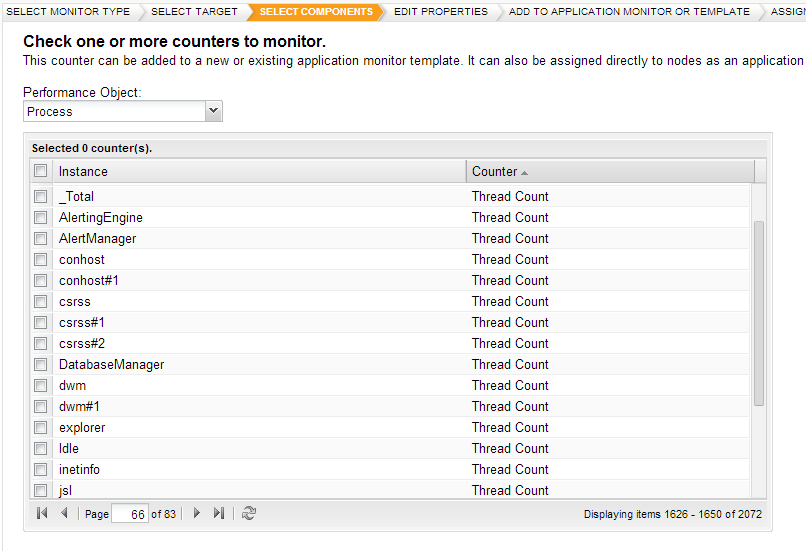
You can select "Thread Count" for the process tied to that service using the Component Monitor Wizard located under [Settings - SAM Settings] as pictured below
Perfect! TYVM!
Is this still possible to do? I'm looking into it and cannot find where to monitor the thread count of a process.
I'd be interested in this as well.
The Monitor Type for this is Window Performance Counter Monitor.
Hi Everyone,
How do you do monitor the service threads on NPM 12.3?
The form doesn't look the same as above anymore.
I think it may be somewhere else.
Thanks much,
Cheryl
That screenshot is from under the browse components section in sam settings, it has not changed. Thread count is just a standard windows perfmon counter.
I can't see this as I should.
[Settings > All Settings > SAM Settings > Component Monitor Wizard > Windows Performance Counter Monitor]
Thanks! I apologize, all I had to do was scroll down and see the threads!
Appreciate your help and time!
I currently have a request to display the number if instances or thread count on a dashboard. The team wants this displayed, they have not asked to alert on it yet. In this case, the exe is related to a remote user connection for this custom application, so they want the visual of the number of connections to each server. Currently the monitor template lists all the connections, but has no count associated that I can see. And that visual is just clutter when there are dozens of this running.
Is there a better way to display this?