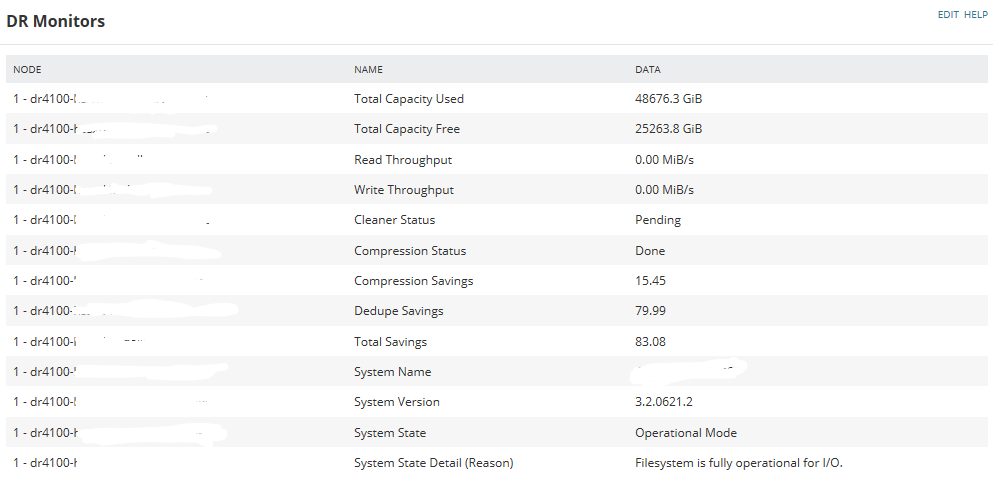
Trying to display data gathered from a custom script monitor within a custom query resource on our dashboard view - however I can't seem to get the query to actually display grouped data - instead I just end up with a list of data as if I didn't group anything in the first place.
select n.Caption as Node, ac.Name, de.StringData as Data from Orion.APM.Application appJOIN Orion.Nodes n
on n.NodeID=app.NodeIDJOIN Orion.APM.Component ac
on ac.ApplicationID=app.ApplicationIDJOIN Orion.APM.ComponentStatus cs
on cs.ComponentID=ac.ComponentIDinner join
(select ComponentID, max(TimeStamp)as TimeStamp from Orion.APM.ComponentStatus
group by ComponentID)cs2
on (cs.ComponentID=cs2.ComponentID and cs.TimeStamp=cs2.TimeStamp)JOIN Orion.APM.DynamicEvidence de
on de.ComponentStatusID=cs.IDwhere app.Name='DR Monitors'
and de.StringData is not NULLand n.NodeID=3639GROUP BY n.Caption, ac.Name, de.StringData, ac.ComponentOrderOrder by ac.ComponentOrder
In this example, I'm pulling one NodeID, but eventually I'll want to do any with the same Application Monitor. It displays all lines - but really I want a node header with components and stats beneath like a typical report.
Thanks in advance for any feedback.