In my environment we have many Orion pollers, and to avoid having a total monitoring blackout we use a staggered schedule for doing things like patches and system reboots. The other day one of our users was asking us about a data gap in one of his reports and my colleague mentioned that they thought it might have coincided with the monthly patch window for that particular polling engine. I was pretty sure he was correct, but I wanted to give myself a way to be able to easily spot check for any time windows when any of my polling engines was not collecting data for any reason so I created this chart.
It is just counting the total number of pings recorded from each polling engine. If a poller is down for some reason we see the drop and can eye ball the duration of the outage. I have two versions of it on a dashboard, one is the last 24 hours broken into 10m samples and another one that goes back 30 days.
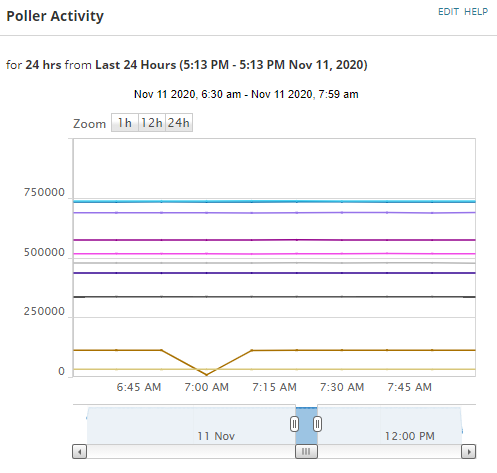
I can see from the screenshot here when I had a quick reboot of a poller at 7am.
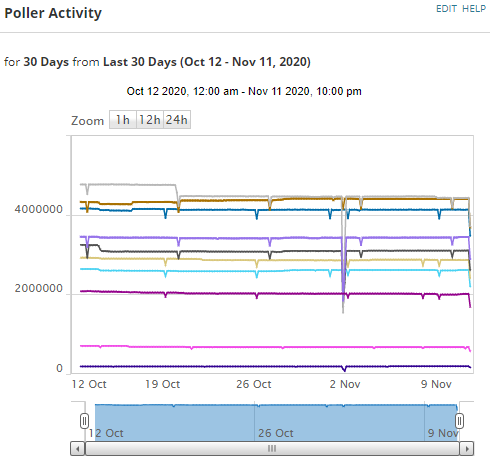
And in the 30 day version of the chart it is pretty easy to spot the cadence of our scheduled reboots, also I see around the 20th I deleted a bunch of decommed nodes and I see we had a more extended downtime on the 2nd when a few of the servers were getting OS patches. With the chart I can see a few other irregularities that I can follow up on with my team as well and hopefully there is less opportunity for problems with polling engines to slip between the cracks.
You can just add this to a Custom Chart resource with SQL data source
select concat(e.ServerName,' - ID ',e.engineid) as ServerName, DATEADD(second, DATEDIFF(second, GETDATE(), GETUTCDATE()), rtg.date) as  date, SUM(rtg.polls) as PingsInInterval

from SolarWindsOrion.dbo.Engines e
left join SolarWindsOrion.dbo.nodes n on n.engineid=e.EngineID
left join (
SELECT rt.nodeid, dateadd(MINUTE,datediff(MINUTE,'2000', rt.DateTime) / 10 * 10, '2000') as date, count(*)*rt.Weight as polls
FROM SolarWindsOrion.dbo.responsetime rt

Where rt.DateTime > dateadd(day,-1,GETDATE())

GROUP BY rt.nodeid, dateadd(MINUTE,datediff(MINUTE,'2000', rt.DateTime) / 10 * 10, '2000'), weight
) rtg on rtg.nodeid=n.nodeid

group by e.EngineID, e.ServerName, e.Nodes, e.Elements, rtg.date
Or if you are into scripting you can download it from my git repo and import the widget directly with powershell.
Get the widget from here - https://github.com/Mesverrum/MyPublicWork/blob/master/ViewsToShare/SingleWidgets/PollerLoadsChart_11501.xml
Get the resource importer here - https://github.com/Mesverrum/MyPublicWork/blob/master/ResourceImporter.ps1