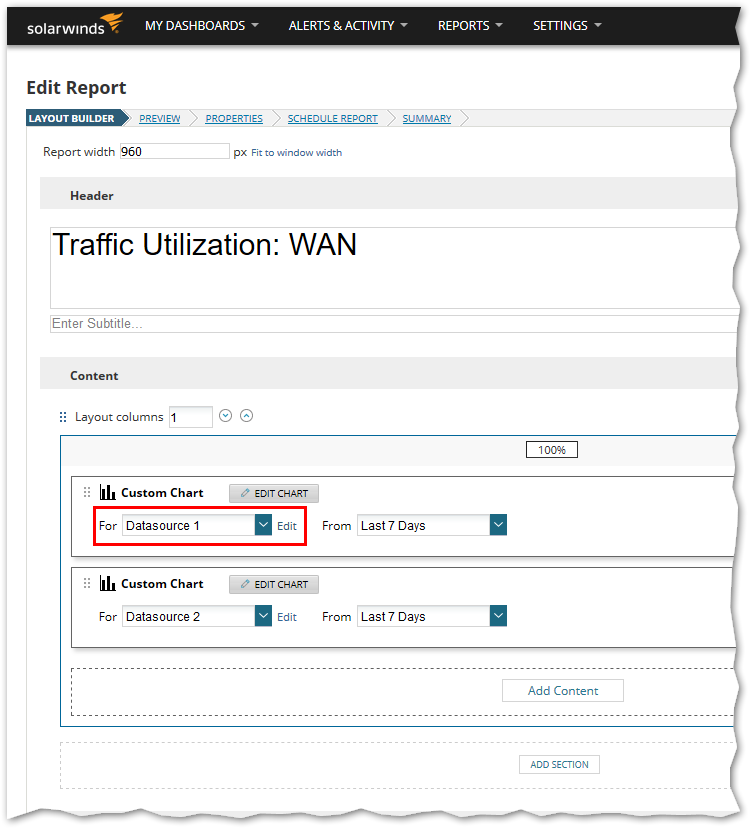
Update the data source to show the interface you'd like to use. If you would like to have multiple charts, each with a single interface, use the 'duplicate' button. For each one you'll need to drop the data source field down and select 'Add new data source'
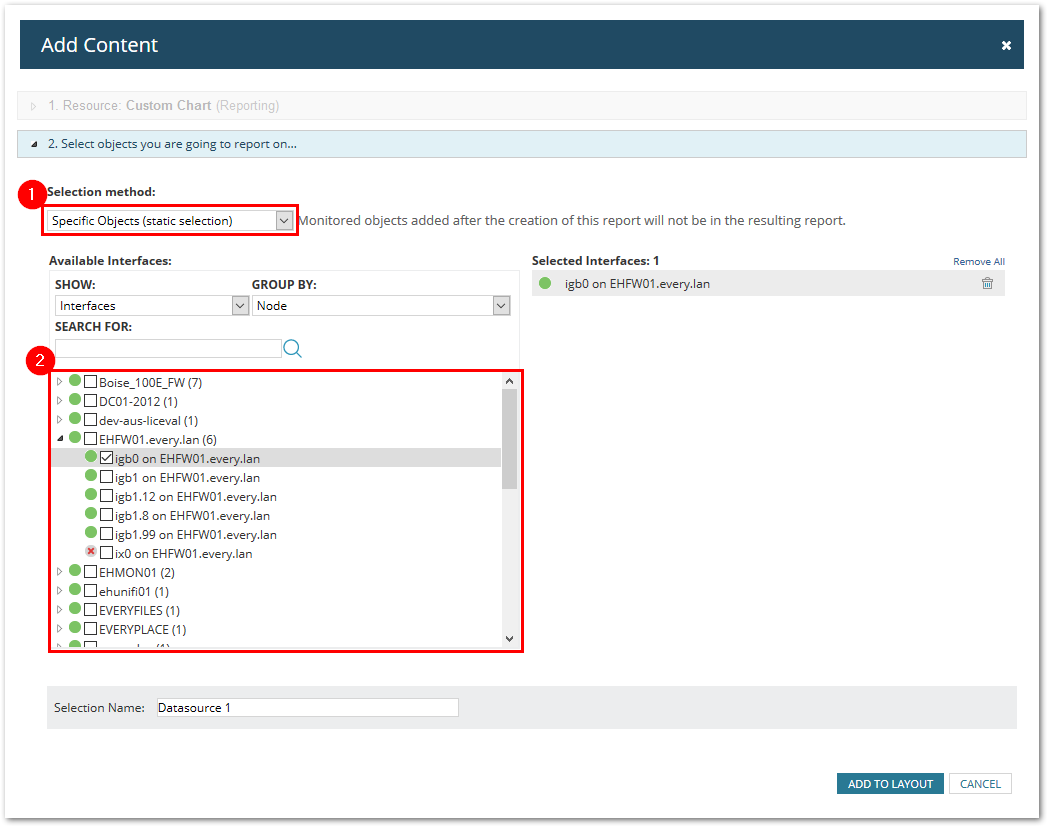
Data Source 1: Using the Specific Object selection
In box #2, just expand the node and check the interface(s) that you would like to graph. They will all be places in the same chart.
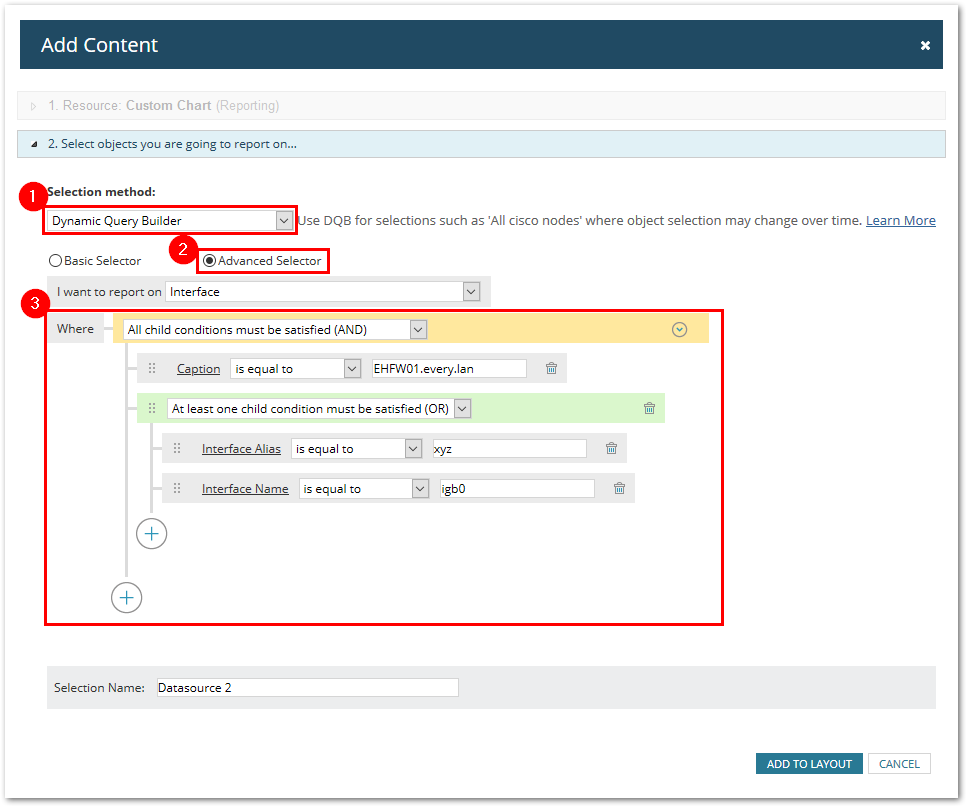
Data Source 2: Dynamic Query Builder/Advanced Selector
Can use a wide variety of combinations to filter with. This example uses the node name and the interface needs to be either named 'igb0' or have an interface alias of 'xyz'