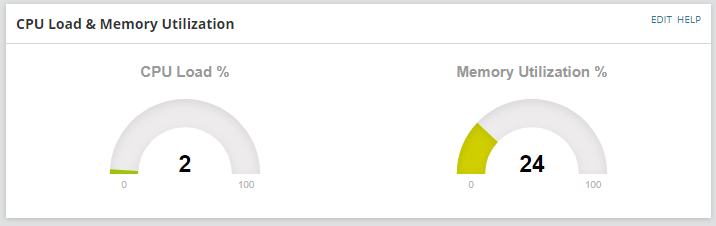
I love a lot of things about the Orion platform, but I'm not particularly fond of the gauges so I decided to design my own.
I replaced the default CPU Load & Memory Utilization widget with this:
Source code:
<!DOCTYPE html>
<html>
<head>
    <meta charset="utf-8" />
    <title></title>
    <script src="https://cdnjs.cloudflare.com/ajax/libs/raphael/2.1.0/raphael-min.js"></script>
    <script src="https://cdnjs.cloudflare.com/ajax/libs/justgage/1.1.0/justgage.js"></script>
   <script type="text/javascript" >

        function drawGauges(){
        var swql = "Select CPULoad,PercentMemoryUsed FROM Orion.Nodes WHERE NodeId=${NodeId}";

        var params = JSON.stringify({
            query: swql,
            parameters: {
            }
        });

        $.ajax({
            type: 'POST',
            url: '/Orion/Services/Information.asmx/QueryWithParameters',
            data: params,
            contentType: "application/json; charset=utf-8",
            dataType: "json",
            success: function (response) {
                console.log(response.d.Rows);
                var g = new JustGage({
                    id: "gauge",
                    value: response.d.Rows[0][0],
                    min: 0,
                    max: 100,
                    title: "CPU Load %"
                });
                var g1 = new JustGage({
                    id: "gauge1",
                    value: response.d.Rows[0][1],
                    min: 0,
                    max: 100,
                    title: "Memory Utilization %"
                });

            }

        });

}


    </script>

 <style>
 * {
            box-sizing: border-box;
        }

        body {
            font-family: Open Sans, sans-serif;
        }

        /* Float four columns side by side */
        .widget_column {
            float: left;
            width: 50%;
            padding: 0 30px;
        }

        .widget_row {
            margin: 0 -5px;
        }

            /* Clear floats after the columns */
            .widget_row:after {
                content: "";
                display: table;
                clear: both;
            }

        /* Responsive columns */
@media screen and (max-width: 600px) {
            .widget_column {
                width: 100%;
                display: block;
                margin-bottom: 10px;
            }
        }

</style>
</head>
<body body onload="drawGauges();">
	 <div class="widget_row">
		 <div class="widget_column">
			<div id="gauge" class="200x160px"></div>
		</div>
		<div class="widget_column">
			<div id="gauge1" class="200x160px"></div>
		</div>
	</div>
</body>
</html>
You can use these gauges for pretty much anything as long as you can write a SWQL query for it (I also use it for interface utilization % for example).
Resources:
justGage.com