Pending some hardware changes, I have bumped up some of our Exchange Application Monitor thresholds to reduce the number of non-actionable alerts. Here you see specifically the I/O Database Reads Average Latency monitor, as it has been adjusted.
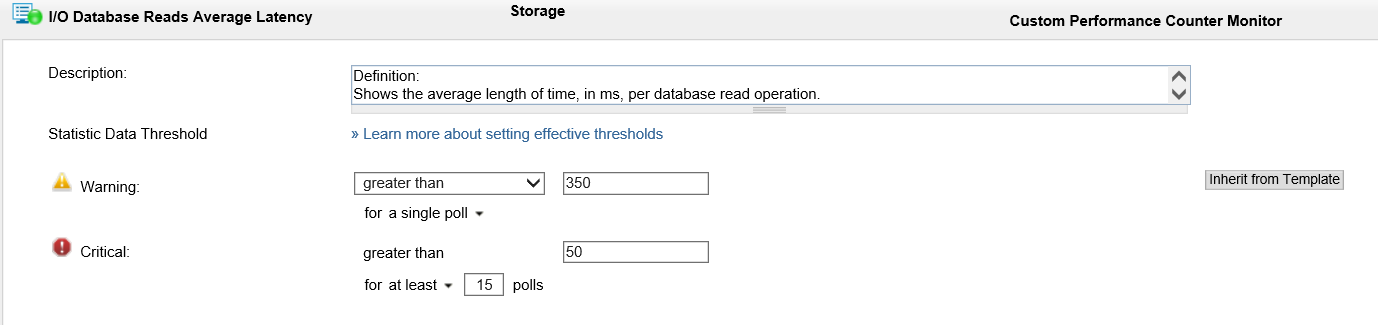
We don't want to hear about spikes up to 350 ms, so I configured the override settings above. However, we are still getting alerts like this one.
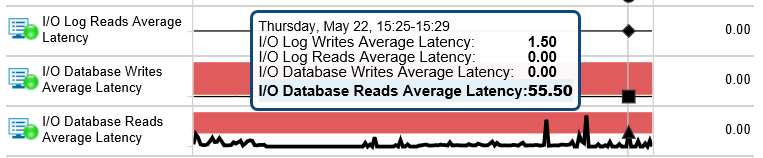
NetPerMon Event Log: Component I/O Database Reads Average Latency on Application Microsoft Exchange on Node TPCP-Exchange is Warning. The statistic for this component is 55.5.
The default threshold is 50, which is also pictured in the graph below. I submitted my changes days ago--late last week. Any ideas why the setting is being ignored?