Pretty much as described. I have lightly modified the default high cpu % alert with Top 10 processes.
In explanation - the alert fires off just fine, everything in the alert email populates as intended except the Top 10 process section is blank.
The ${Notes} returns nothing at all, in any testing I've completed.
In reading and working on this I've come across several different approaches to correcting increasing timeout on the Trigger Action as below (previously it was default):
---------------------------------------------------------------------------------
APM\SolarWinds.APM.RealTimeProcessPoller.exe -n=${NodeID} -count=10 -alert=${AlertDefID} -timeout=90
------------------------------------------------------------------------------
The CPU on ${Caption} is currently running at ${CPULoad}.
${Caption} is running ${MachineType}.
IP Address is ${Node.IP_Address} ${CrLf}
${Caption} is currently ${Status}
The top 10 processes (sorted by processor time) within the last 10 minutes are listed below:
Notes:
${Notes}
For more information click the link below.
${NodeDetailsURL}
---------------------------------------------------------------------------
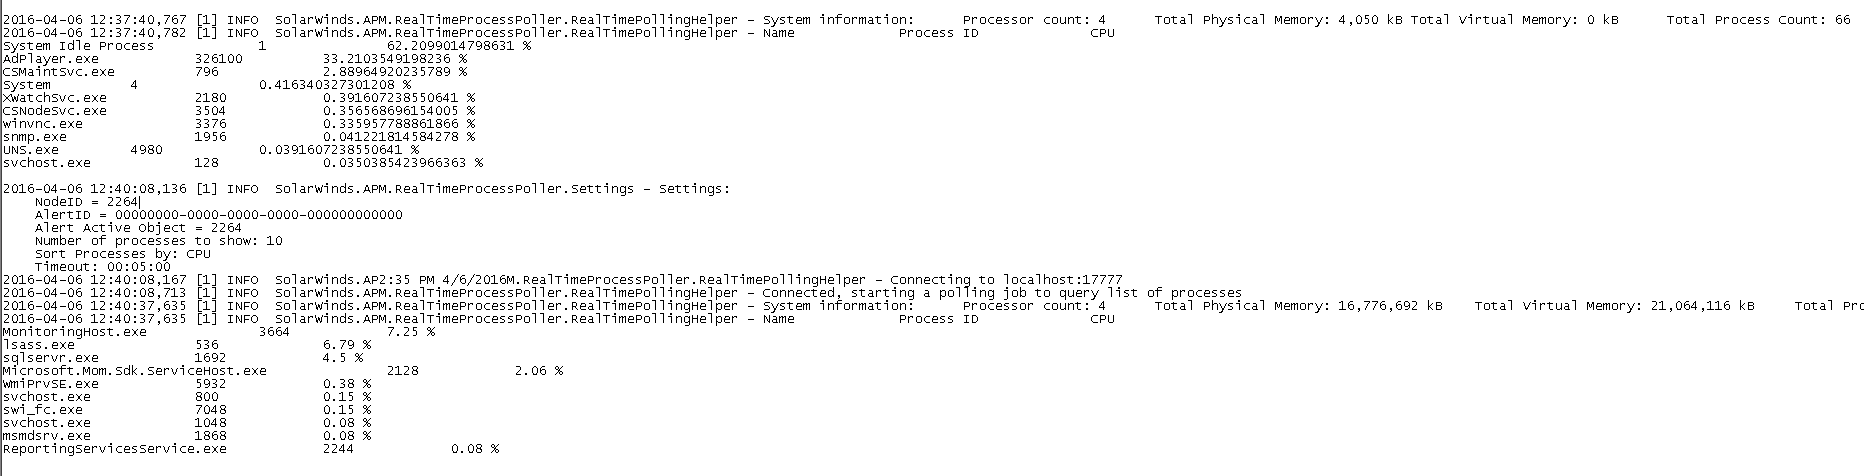
Here's an example from the RealTimeProcessPoller.log file - I can see that it's collecting the process information - but it's not making it to the email.
All help is appreciated!!
Thank you!