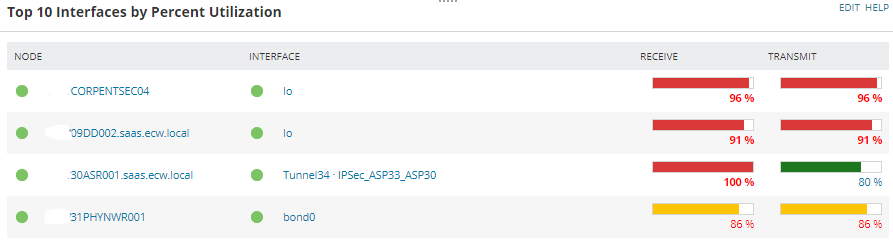
We have used default template for Top 10 Interfaces by Percent Utilization
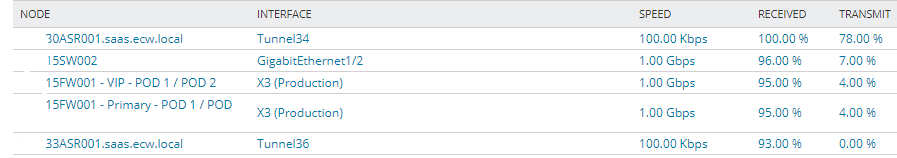
Here there is no option for Interface Speed. So I have crated custom table for the same.
Here don't have the Utilization Bar (Graphical).
Please suggest if have any solution.
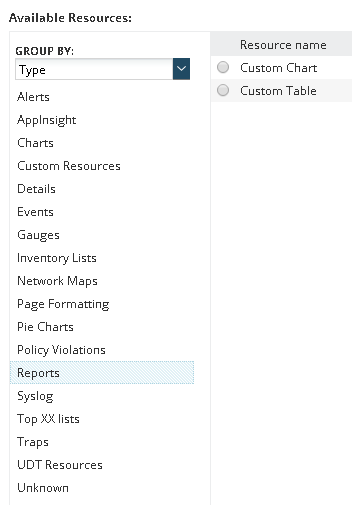
The web based report writer has the capability to display any of the resources you see on the summary pages. On the Add Content section where you normally choose either a chart or a table you can just click the available resources in the left section of the page and you can find one you want.
-Marc Netterfield
Loop1 Systems: SolarWinds Training and Professional Services
Bump, and sorry for the necro. I have the same question and haven't found a solution yet.
I would like to create a custom table with more information than what is included in the canned ones. For example, Receive/Transmit utilization bars side-by-side with speed, received/transmitted bytes, discards, other interface info.
The out of the box resources cannot have additional information added to them. You can make a custom report with a table and use icons and such to indicate the utilization rates, but if it HAS to be a bar then you are going to be getting into the realm of rolling your own.
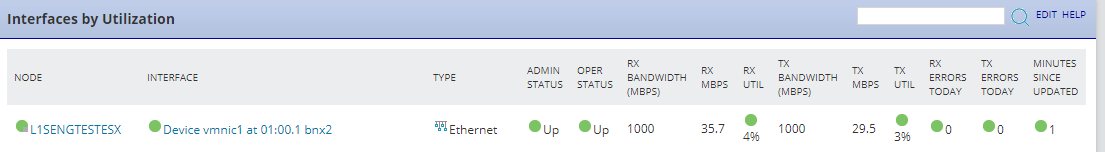
This is SWQL the report I use in a custom query resource for interface info if you want to use it as a starting point
SELECT top 10
i.node.Caption as [Node]
,i.node.DetailsUrl as [_linkfor_Node]
,'/Orion/images/StatusIcons/Small-' + i.node.StatusIcon AS [_IconFor_Node]
, Name as [Interface]
, Detailsurl as [_linkfor_Interface]
,'/Orion/images/StatusIcons/Small-' + StatusIcon as [_iconfor_Interface]
, TypeDescription as [Type]
,'/NetPerfMon/images/Interfaces/' + Icon as [_iconfor_Type]
, adm.StatusName as [Admin Status]
,'/Orion/images/StatusIcons/Small-' + AdminStatusLED as [_iconfor_Admin Status]
, oper.StatusName as [Oper Status]
,'/Orion/images/StatusIcons/Small-' + OperStatusLED as [_iconfor_Oper Status]
, InBandwidth/1000000 as [RX Bandwidth (Mbps)]
, round(Inbps/1000000,1) as [RX Mbps]
, tostring(InPercentUtil) + '%' as [RX Util]
,case when InPercentUtil>=i.InPercentUtilizationThreshold.Level2Value then '/Orion/images/StatusIcons/Small-Critical.gif'
when InPercentUtil>=i.InPercentUtilizationThreshold.Level1Value then '/Orion/images/StatusIcons/Small-Warning.gif'
else '/Orion/images/StatusIcons/Small-Up.gif'
end as [_iconfor_RX Util]
, OutBandwidth/1000000 as [TX Bandwidth (Mbps)]
, round(Outbps/1000000,1) as [TX Mbps]
, tostring(OutPercentUtil) + '%' as [TX Util]
,case when OutPercentUtil>=i.OutPercentUtilizationThreshold.Level2Value then '/Orion/images/StatusIcons/Small-Critical.gif'
when OutPercentUtil>=i.OutPercentUtilizationThreshold.Level1Value then '/Orion/images/StatusIcons/Small-Warning.gif'
end as [_iconfor_TX Util]
, InErrorsToday as [RX Errors Today]
,case when inerrorstoday>0 then '/Orion/images/StatusIcons/Small-Critical.gif'
end as [_iconfor_RX Errors Today]
, OutErrorsToday as [TX Errors Today]
,case when outerrorstoday>0 then '/Orion/images/StatusIcons/Small-Critical.gif'
end as [_iconfor_TX Errors Today]
, minutediff(LastSync, getutcdate()) as [Minutes Since Updated]
,case when minutediff(LastSync, getutcdate())> i.PollInterval then '/Orion/images/StatusIcons/Small-Critical.gif'
end as [_iconfor_Minutes Since Updated]
FROM Orion.NPM.Interfaces i
join orion.StatusInfo adm on adm.statusid=i.adminstatus
join orion.StatusInfo oper on oper.statusid=i.OperStatus
--where (i.fullname like '%${SEARCH_STRING}%')
order by percentutil desc
Thanks! This is exactly the starting point I was hoping for!