Hi Twack,
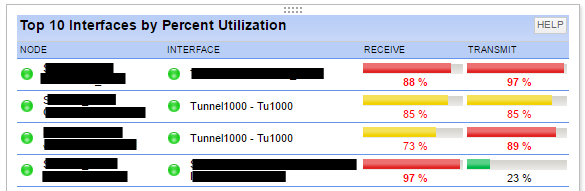
Support pointed me here as they don't seem to like anything involving customization  . I'm trying to replicate the look of the "Top 10 Interfaces by Percent Utilization" resource, in my own custom query resource. This seemed like the best way to select a bunch of interfaces from different devices of my choosing. The problem I am having is i'm unable to work out how to display the percentages as colored bars.
Top 10 resource:
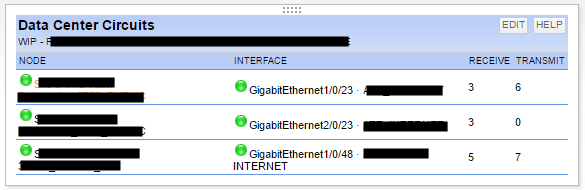
Custom resource:
I assume there is some kind of [Percent_For_*] option, but it would appear to be undocumented and I've been unable to find anything on thwack.
Here's my query in the interest of sharing:
SELECT
NODE.Caption AS NODE,
INT.InterfaceCaption AS INTERFACE,
INT.InPercentUtil AS RECEIVE,
INT.OutPercentUtil AS TRANSMIT,
'/Orion/images/StatusIcons/Small-' + INT.StatusIcon AS [_IconFor_INTERFACE],
'/Orion/images/StatusIcons/Small-' + NODE.StatusIcon AS [_IconFor_NODE],
INT.DetailsUrl AS [_LinkFor_INTERFACE],
NODE.DetailsUrl AS [_LinkFor_NODE]
FROM Orion.Nodes NODE
LEFT OUTER JOIN Orion.NPM.Interfaces INT ON INT.NodeID = NODE.NodeID
WHERE
(
(NODE.NodeID = 123 AND INT.Name = 'GigabitEthernet1/0/23')
OR
(NODE.NodeID = 123 AND INT.Name = 'GigabitEthernet2/0/23')
OR
(NODE.NodeID = 1234 AND INT.Name = 'GigabitEthernet1/0/48')
)