With the help of antonis.athanasiou (yay MVP collab!), I came up with the following born out of need:
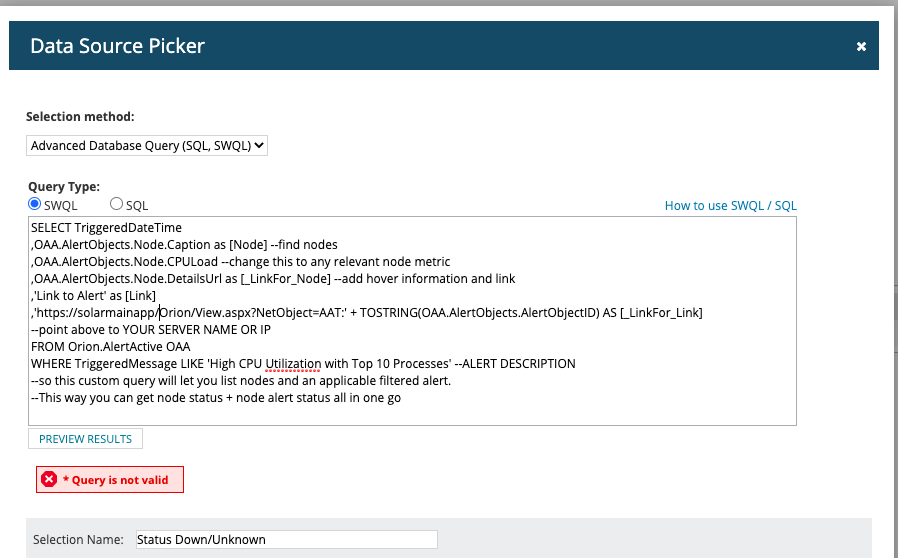
SELECT TriggeredDateTime,OAA.AlertObjects.Node.Caption as [Node] --find nodes,OAA.AlertObjects.Node.CPULoad --change this to any relevant node metric,OAA.AlertObjects.Node.DetailsUrl as [_LinkFor_Node] --add hover information and link,'Link to Alert' as [Link],'YOURSERVERNAME/.../View.aspx' + TOSTRING(OAA.AlertObjects.AlertObjectID) AS [_LinkFor_Link] --point above to YOUR SERVER NAME OR IPFROM Orion.AlertActive OAA WHERE TriggeredMessage LIKE 'High CPU Utilization with Top 10 Processes' --ALERT DESCRIPTION--so this custom query will let you list nodes and an applicable filtered alert. --This way you can get node status + node alert status all in one go
So the gist is this. You specify what alert and what you want to display in your nodes via #SWQL, pop it into a custom query widget, and then you get nodes with their status (maybe the status is associated with the relevant alert).
In my case, I want to display CPU status of the nodes that trigger the high cpu utilization. Pop it all into a custom query and you get this:
as a great handy small widget to show you the reason why this node is in alert, because as of last poll it was at....96% CPU. Plus hover information thanks to handy dandy SWQL macros. This will put together the link to the alert as mentioned.