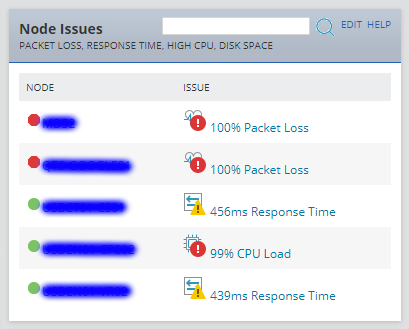
One of my SolarWinds priorities is displaying as much actionable information as possible without burning up half the screen with empty panels. This panel has been through a number of revisions, but is (more or less) useful now. This SWQL Custom Query creates a panel that consolidates:
- Nodes with High Packet Loss
- Nodes with High Response Time
- Nodes with High Average CPU Load
- Volumes with High Percentage Usage
- Nodes with High Memory Utilization
Clicking on the issue opens up a 7 day perfstack analysis. Clicking/Hovering over the node name works as you would expect.
It is also searchable by node name or issue name (packet loss, response time, high cpu, cpu load, disk space, memory used).
I hope people find this useful. It saves a ton of space on our NOC display.
--
-- Node Issues Panel - SWQL Custom Query Resource
--   3-Jan-2020 Christopher Camacho
--
-- Conserve screen space by consolidating 5 panels into 1
--  * Nodes with High Packet Loss
--  * Nodes with High Response Time
--  * Nodes with High Average CPU Load
--  * Volumes with High Percentage Usage
--  * Nodes with High Memory Utilization
--
-- Click/Hover on Node Name for Node Details
-- Click on Issue to open PerfStack Analysis (7 Days)
-- Search by Node Name or Issue (Packet Loss, Response Time, High CPU, CPU Load, Disk Space, Memory Used)
--

-- DISK SPACE BLOCK
SELECT N0.Caption AS [Node],
    N0.DetailsUrl AS [_LinkFor_Node],
    '/Orion/images/StatusIcons/Small-'+N0.StatusIcon AS [_IconFor_Node],
    ' '+toString(Round(ov.VolumePercentUsed,0))+'% '+ov.Caption AS [Issue],
    '/ui/perfstack/?presetTime=last7Days&charts=0_Orion.Volumes_'
        +toString(ov.VolumeID)+'-Orion.VolumeUsageHistory.PercentDiskUsed;'
        AS [_LinkFor_Issue],
    CASE
        WHEN (ov.VolumePercentUsed>=ov.ForecastCapacity.CriticalThreshold)
            THEN '/Orion/HardwareHealth/Images/StatusIcons/Object-Sensor_FileServer-Critical.png'
        WHEN (ov.VolumePercentUsed>=ov.ForecastCapacity.WarningThreshold)
            THEN '/Orion/HardwareHealth/Images/StatusIcons/Object-Sensor_FileServer-Warning.png'
        ELSE '/Orion/HardwareHealth/Images/StatusIcons/Object-Sensor_FileServer-Up.png'
    END AS [_IconFor_Issue]
    FROM Orion.Volumes ov
        LEFT JOIN Orion.Nodes AS N0 ON N0.NodeID=ov.NodeID
        WHERE N0.UnManaged=FALSE AND
            (ov.VolumePercentUsed>=ov.ForecastCapacity.WarningThreshold)
-- Uncomment the next line when enabling search
--            AND ('Disk Space' LIKE '%${SEARCH_STRING}%' OR ov.Caption LIKE '%${SEARCH_STRING}%' OR N0.Caption LIKE '%${SEARCH_STRING}%')

-- BEGIN PACKET LOSS BLOCK
UNION
(
    SELECT N0.Caption AS [Node],
    N0.DetailsUrl AS [_LinkFor_Node],
    '/Orion/images/StatusIcons/Small-'+N0.StatusIcon AS [_IconFor_Node],
    ' '+toString(N0.PercentLoss)+'% Packet Loss' AS [Issue],
    '/ui/perfstack/?context=0_Orion.Nodes_'+toString(N0.NodeID)
        +'&withRelationships=true&presetTime=last7Days&charts=0_Orion.Nodes_'
        +toString(N0.NodeID)+'-Orion.ResponseTime.PercentLoss;'
        AS [_LinkFor_Issue],
    CASE
        WHEN (N0.PercentLoss>=N0.PercentLossThreshold.Level2Value)
            THEN '/Orion/HardwareHealth/Images/StatusIcons/Object-Sensor_Generic-Critical.png'
        WHEN (N0.PercentLoss>=N0.PercentLossThreshold.Level1Value)
            THEN '/Orion/HardwareHealth/Images/StatusIcons/Object-Sensor_Generic-Warning.png'
        ELSE '/Orion/HardwareHealth/Images/StatusIcons/Object-Sensor_Generic-Up.png'
    END AS [_IconFor_Issue]
    FROM Orion.Nodes N0
        WHERE N0.UnManaged=FALSE AND N0.External=FALSE AND
            (N0.PercentLoss>=N0.PercentLossThreshold.Level1Value)
-- Uncomment the next line when enabling search
--            AND ('Packet Loss' LIKE '%${SEARCH_STRING}%' OR N0.Caption LIKE '%${SEARCH_STRING}%')
)

-- BEGIN CPU LOAD BLOCK
UNION
(
    SELECT N0.Caption AS [Node],
    N0.DetailsUrl AS [_LinkFor_Node],
    '/Orion/images/StatusIcons/Small-'+N0.StatusIcon AS [_IconFor_Node],
    ' '+toString(N0.CPUload)+'% CPU Load' AS [Issue],
    '/ui/perfstack/?context=0_Orion.Nodes_'+toString(N0.NodeID)
        +'&withRelationships=true&presetTime=last7Days&charts=0_Orion.Nodes_'
        +toString(N0.NodeID)+'-Orion.CPULoad.AvgLoad;'
        AS [_LinkFor_Issue],
    CASE
        WHEN (N0.CPUload>=N0.CpuLoadThreshold.Level2Value)
            THEN '/Orion/HardwareHealth/Images/StatusIcons/Object-Sensor_CPU-Critical.png'
        WHEN (N0.CPUload>=N0.CpuLoadThreshold.Level1Value)
            THEN '/Orion/HardwareHealth/Images/StatusIcons/Object-Sensor_CPU-Warning.png'
        ELSE '/Orion/HardwareHealth/Images/StatusIcons/Object-Sensor_CPU-Up.png'
    END AS [_IconFor_Issue]
    FROM Orion.Nodes N0
        WHERE N0.UnManaged=FALSE
            AND (N0.CPUload>=N0.CpuLoadThreshold.Level1Value)
-- Uncomment the next line when enabling search
--            AND ('CPU Load' LIKE '%${SEARCH_STRING}%' OR 'High CPU' LIKE '%${SEARCH_STRING}%' OR N0.Caption LIKE '%${SEARCH_STRING}%')
)

-- BEGIN RESPONSE TIME BLOCK
UNION
(
    SELECT N0.Caption AS [Node],
    N0.DetailsUrl AS [_LinkFor_Node],
    '/Orion/images/StatusIcons/Small-'+N0.StatusIcon AS [_IconFor_Node],
    ' '+toString(N0.ResponseTime)+'ms Response Time' AS [Issue],
    '/ui/perfstack/?context=0_Orion.Nodes_'+toString(N0.NodeID)
        +'&withRelationships=true&presetTime=last7Days&charts=0_Orion.Nodes_'
        +toString(N0.NodeID)+'-Orion.ResponseTime.AvgResponseTime;'
        AS [_LinkFor_Issue],
    CASE
        WHEN N0.ResponseTime>=N0.ResponseTimeThreshold.Level2Value
            THEN '/Orion/HardwareHealth/Images/StatusIcons/Object-Sensor_Switch-Critical.png'
        WHEN N0.ResponseTime>=N0.ResponseTimeThreshold.Level1Value
            THEN '/Orion/HardwareHealth/Images/StatusIcons/Object-Sensor_Switch-Warning.png'
        ELSE '/Orion/HardwareHealth/Images/StatusIcons/Object-Sensor_Switch-Up.png'
    END AS [_IconFor_Issue]
    FROM Orion.Nodes N0
        WHERE N0.UnManaged=FALSE AND N0.External=FALSE AND
            (N0.ResponseTime>=N0.ResponseTimeThreshold.Level1Value)
-- Uncomment the next line when enabling search
--            AND ('Response Time' LIKE '%${SEARCH_STRING}%' OR N0.Caption LIKE '%${SEARCH_STRING}%')
)

--BEGIN MEMORY USED BLOCK
UNION
(
    SELECT N0.Caption AS [Node],
    N0.DetailsUrl AS [_LinkFor_Node],
    '/Orion/images/StatusIcons/Small-'+StatusIcon AS [_IconFor_Node],
    ' '+toString(PercentMemoryUsed)+'% Memory Used' AS [Issue],
    '/ui/perfstack/?context=0_Orion.Nodes_'+toString(N0.NodeID)
    +'&withRelationships=true&presetTime=last7Days&charts=0_Orion.Nodes_'
    +toString(N0.NodeID)+'-Orion.CPULoad.AvgPercentMemoryUsed;'
        AS [_LinkFor_Issue],
    CASE
        WHEN N0.PercentMemoryUsed>=N0.PercentMemoryUsedThreshold.Level2Value
            THEN '/Orion/HardwareHealth/Images/StatusIcons/Object-Sensor_Memory-Critical.png'
        WHEN N0.PercentMemoryUsed>=N0.PercentMemoryUsedThreshold.Level1Value
            THEN '/Orion/HardwareHealth/Images/StatusIcons/Object-Sensor_Memory-Warning.png'
        ELSE '/Orion/HardwareHealth/Images/StatusIcons/Object-Sensor_Memory-Up.png'
    END AS [_IconFor_Issue]
    FROM Orion.Nodes N0
        WHERE N0.UnManaged=FALSE AND
            (N0.PercentMemoryUsed>=N0.PercentMemoryUsedThreshold.Level1Value)
-- Uncomment the next line when enabling search
--            AND ('Memory Used' LIKE '%${SEARCH_STRING}%' OR N0.Caption LIKE '%${SEARCH_STRING}%')
)
-- END OF BLOCKS - DO NOT DELETE/COMMENT 'ORDER BY' LINE BELOW

ORDER BY [Node], [Issue]