I'm trying to create two interface charts, one which has Tx and Rx as separate items for a switch interface, and one that has the Tx + Rx for the same interface. However, the latter chart is wrong; it can't possibly be showing Tx + Rx... ?
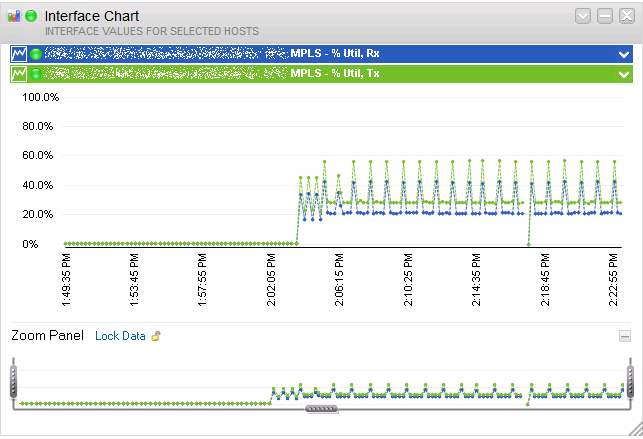
Here is the Tx and Rx graph:
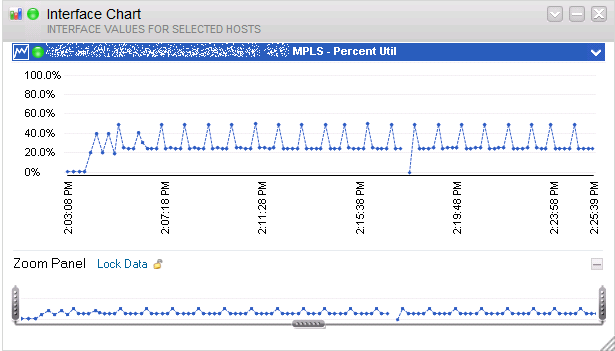
Here is the Tx + Rx graph. Notice how it's obviously not Tx + Rx, which would be 70-90%.