Hi Everyone,
I am monitoring oracle database in SAM and i am monitoring following components
1. Available free memory (MB)
2. Available free space (MB)
3. Buffer cache hit ratio (%)
4. Dictionary cache hit ratio (%)
5. Disk sort operations
;
;
;
;up to 15 components are there.
I would like to see the every components statistics in pictorial way on same page.
Please see the below snap shot for Available free memory(MB) components statistics.
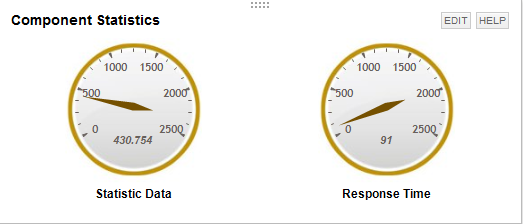
Please advice how do i see all components statistics on same page rather then drilling each components.
Thanks