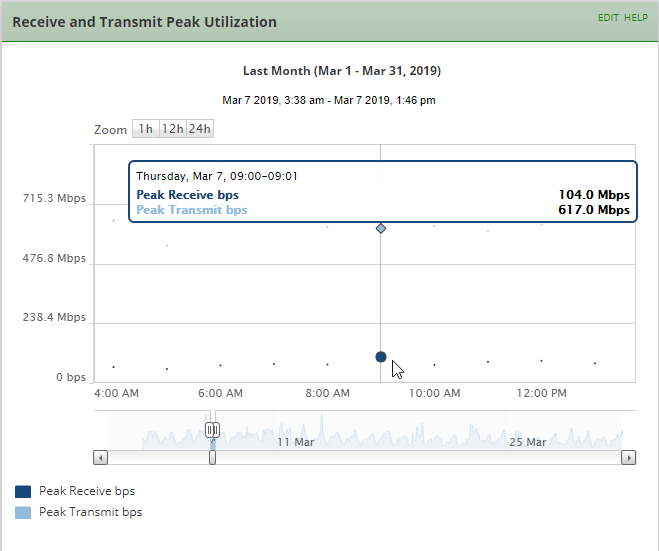
I've created a custom graph on an interface that shows the peak transmit and receive bps, and I've also set the statistics collection to every 1 minute. This allows me to zoom in and see minute-by-minute data sampling. I've been unable to figure out how to replicate this same information in a report. Here's the graph:
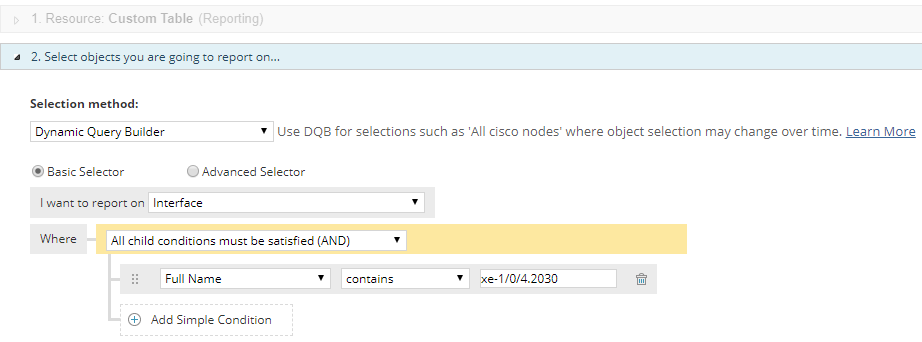
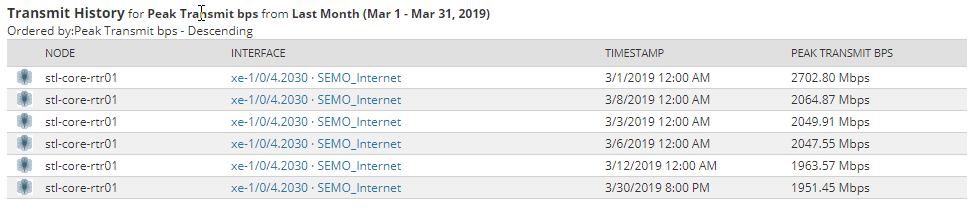
I'm able to make a report and use the peak transmit and receive bps data, but I can't set a sample interval lower than each hour. This is the case even when creating a reporting that only monitors statistics within the last day, last few days, etc. Is it possible to use the minute-by-minute data sampling from the custom graph to create a report, or somehow use a sampling interval lower than each hour? The goal is to create a report that shows the peak transmit and receive bps each day of the past month. If a sampling interval of one minute was available, this should be possible.

Thanks for the guidance.