Greetings.
I've used the Solarwinds SAM product for about a year.
Question: how to use data collected by an application component monitor in, for example, a custom table?
Example: Let's say I have 4 Windows Domain Controllers - DC1, DC2, DC3, DC4 .
Build a custom component monitor to pull, say "LDAP Searches Per Second". Very good.
Understood that I can pull an application widget into a view and see the results of that component monitor, which by default has a graphic and a bunch of data about that application along with the actual "statistic" displayed with other data in a view tile.
But... what if I just want to build a custom table with the server names and the statistic. Like this:
SERVER NAME LDAP SEARCHES/SEC
DC1 230
DC2 314
DC3 157
DC4 278
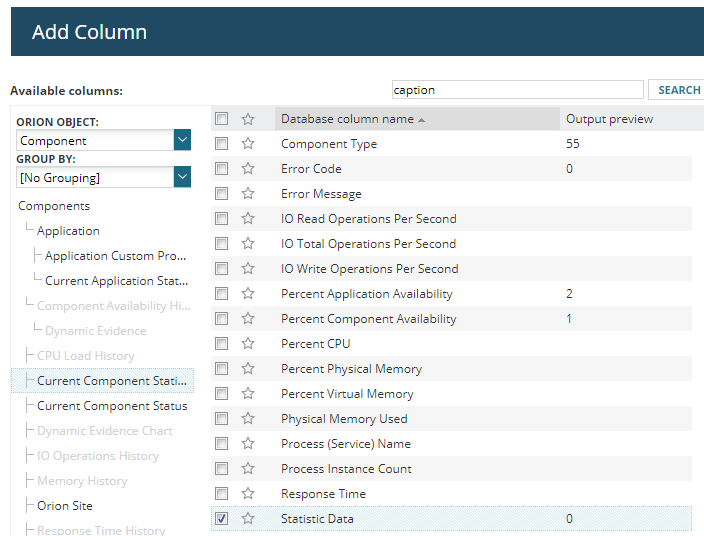
I have looked under the Data Source section and the "select columns" part of reports and custom tables, Application table, and I cannot find the actual statistic (counter) that the component monitor was set up to pull.
Can someone offer guidance on the best way to use counters pulled via application component monitor in reports and tables other than the "applications" widget? Thanks.