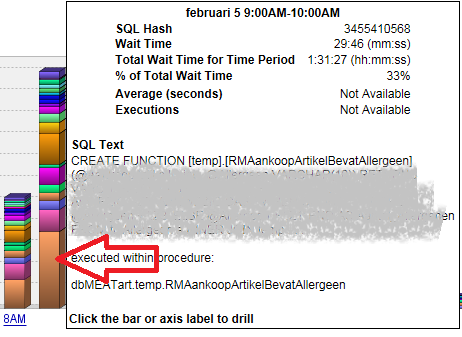
In our monitor, we see a SQL statement that creates a large Wait Time.
But that statements is unused, it is called nowhere. Even when we delete the statement from our database, it's still present in the monitor.
So I started searching why that was, and this is what I found.
First I got the SQL Hash, that is easily found in the overview:
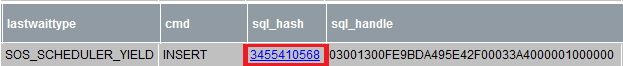
Then I went to the current session overview, and I looked for the same SQL Hash:
Then I used this query to find the SQL Text:
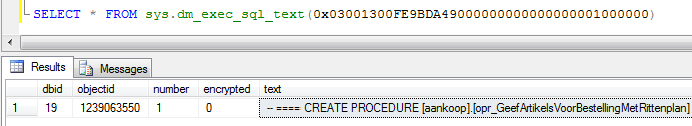
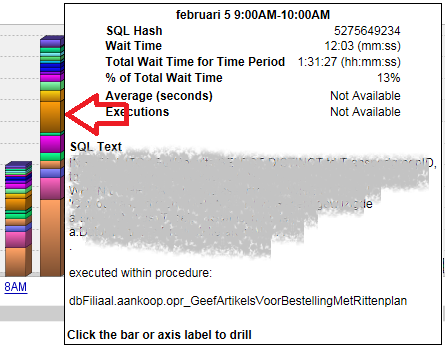
And then I found out that it was actually an other statement. What also caught my eye, is that both statements where the only ones that didn't have 'Average (seconds)' nor 'Executions' available.
So my first question is: is my above stament correct? If so, I know which statement to optimize.
And does anyone has an idea how to reset the SQL Text & start monitoring the Executions again?